
Figure 1. Effect of pH on the hP2X4 receptor.
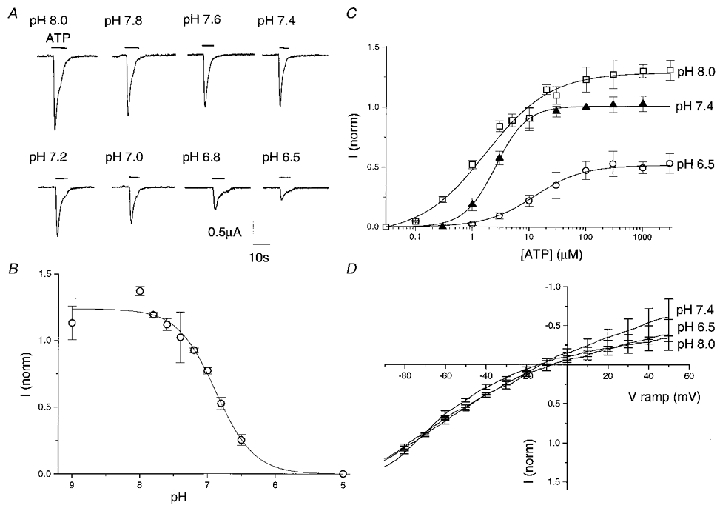
A, example of responses of the hP2X4 receptor to 300 μM ATP over a pH range from 8.0 to 6.5 recorded from a single oocyte. B, pH concentration-response curve. Responses evoked at 300 μM ATP over a range of pH from 9 to 5 were normalized to the response recorded in the same oocyte at 100 μM ATP, pH 7.4. Data plotted are means ±s.e.m. (n = 4). C, ATP concentration-response curves for the hP2X4 receptor at pH 6.5 (^), 7.4 (▴) and 8.0 (□). Responses were evoked at a range of ATP concentrations from 0.03 μM to 3 mM and normalized to the response recorded in the same oocyte at 100 μM ATP, pH 7.4. Values plotted are means ±s.e.m. (n ≥ 5). D, current-voltage relationship of the hP2X4 receptor at pH 8.0, 7.4 and 6.5, with ATP EC20. Currents were obtained by voltage ramps from -90 to +50 mV and normalized to the response obtained at -80 mV for each test pH. Data are shown as means ±s.e.m. (n = 4).