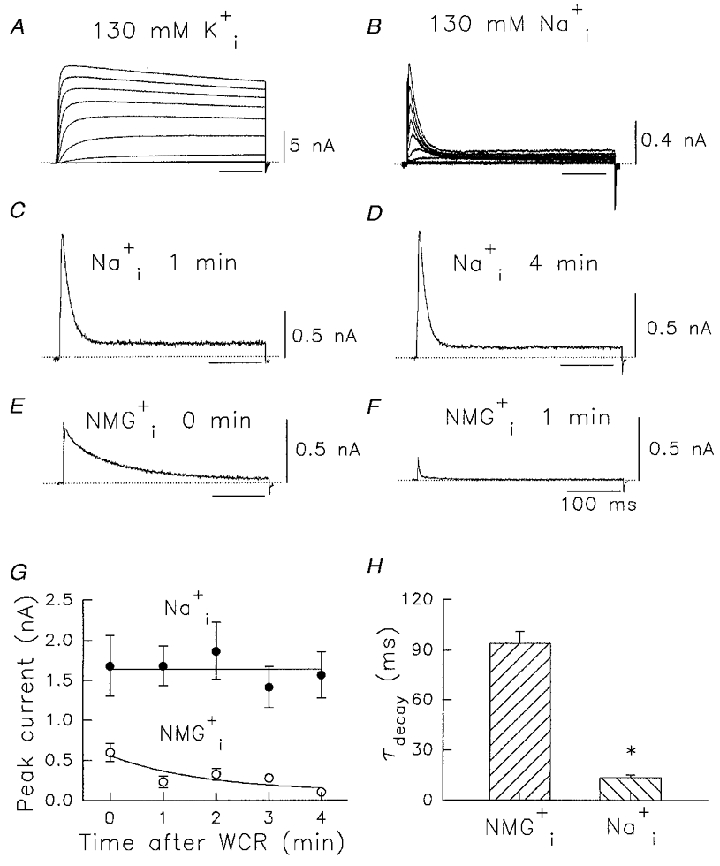
Figure 1. Permeation of Na+ through Kv1.5 channels.

A, currents recorded in 130 mM /5 mM during voltage pulses in 10 mV steps from -60 to +40 mV for 500 ms from a holding potential of -80 mV. B, as for A but in 130 mM /5 mM . C-H, lack of effect of cell dialysis on Na+ currents. C and D, currents elicited by voltage pulses from -80 mV to +60 mV for 400 ms in 130 mM /5 mM after 1 and 4 min WCR, respectively. E and F, currents elicited by the same voltage pulse protocol as in C and D, but NMG+ replaced Na+, after 0 and 1 min WCR, respectively. Dotted lines indicate zero current level in A-F. Time calibration value in F applies also to A–E. G, change in peak recorded currents with time of WCR. •, data recorded under the same conditions as in C and D; ^, data recorded under the same conditions as in E and F. The NMG+ data were fitted to a single exponential decay process with a time constant of 1.8 min. H, time constants of decay of current transients with / or /. data are significantly different from data (*P < 0.001). Data in G and H are means ±s.e.m. (n = 4–10).
