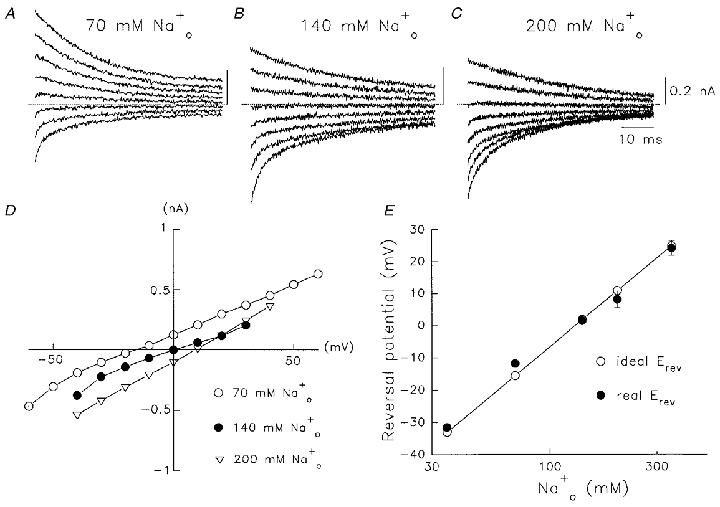
Figure 2. Concentration dependence of Na+ current reversal potentials.

A-C, families of Na+ tail currents through Kv1.5 channels after 15 ms depolarizations to +60 mV from a holding potential of -80 mV. Currents were obtained on repolarization to between +30 mV and -40 mV in 10 mV steps. Dotted lines denote zero current in each panel. was 130 mM in each case, is indicated above the records. The current calibration value and time calibration in C apply also to A and B. D, instantaneous tail I–V relations at the indicated concentrations. The current amplitude was measured immediately on return from +60 mV. E, correlation of measured reversal potentials (real Erev) with predictions from the Nernst equation (ideal Erev). Data are shown as means ±s.e.m. (n = 5–9).
