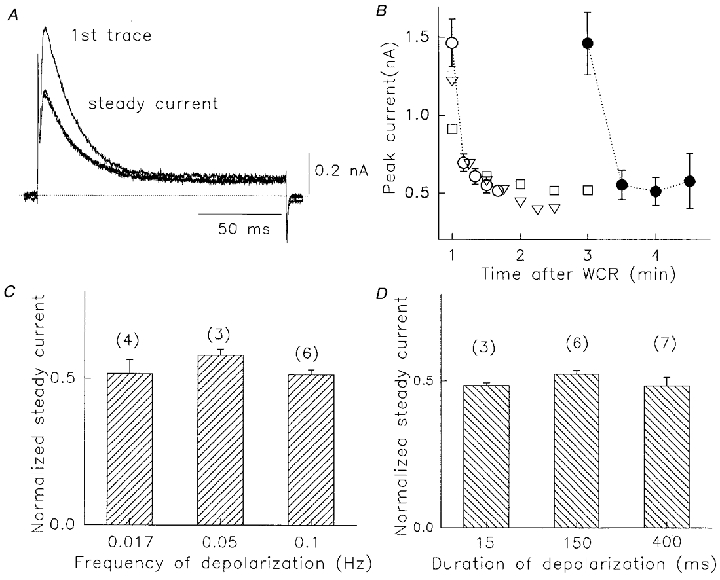
Figure 4. Use-dependent reduction of peak Na+ current in the absence of K+.

A, Na+ currents recorded 1 min after WCR. Pulses were from -80 to +60 mV at 0.05 Hz. Currents are shown in response to the first three voltage pulses. The second and third pulse current indicated the steady-state level. Dotted line denotes zero current. B, use-dependent decline in peak Na+ currents. Pulses (400 ms) were given 1 min (open symbols, n = 7) or 3 min (filled circles, n = 7) after WCR, at 0.1 (^), 0.067 (▿) or 0.033 (□ and •) Hz. C, ratio of steady-state current to peak current at three pulse rates, 0.017, 0.05 and 0.1 Hz. Pulses were to +60 mV for 400 ms. D, ratio of steady-state current to peak current at three pulse durations, 15, 150 and 400 ms. Rate was 0.05 Hz. In B-D, values are means ±s.e.m. No significant differences were observed.
