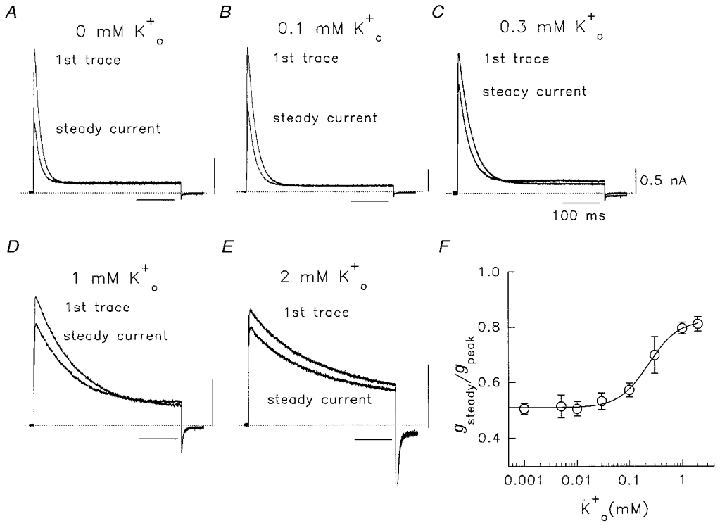
Figure 6. Use-dependent reduction of Na+ conductance during pulsing in various .

A-E, after a 1 min dialysis period, the cell was pulsed to +60 mV for 400 ms at 0.05 Hz in 130 mM /5 mM plus various concentrations of as indicated. The first current trace and the trace after a steady state was reached (2-3 pulses) are shown. Dotted lines denote zero current. Calibration values in C apply also to A, B, D and E. F, normalized relationship of steady current conductance to peak (first pulse) conductance (gsteady/gpeak) as a function of concentration. Plotted points are from means of 3–22 observations. The line was fitted through data using a Hill equation: f = 1/(1 + (Kd/[K+])nH), where f is the fractional conductance ratio, Kd represents the K+ concentration which produced 50 % of the maximum response and nH is the Hill coefficient. For added , the Kd was 230 μM and nH was 1.55.
