
Figure 7. Use-dependent reduction of Kv1.5 Na+ currents is modulated by addition or removal of .
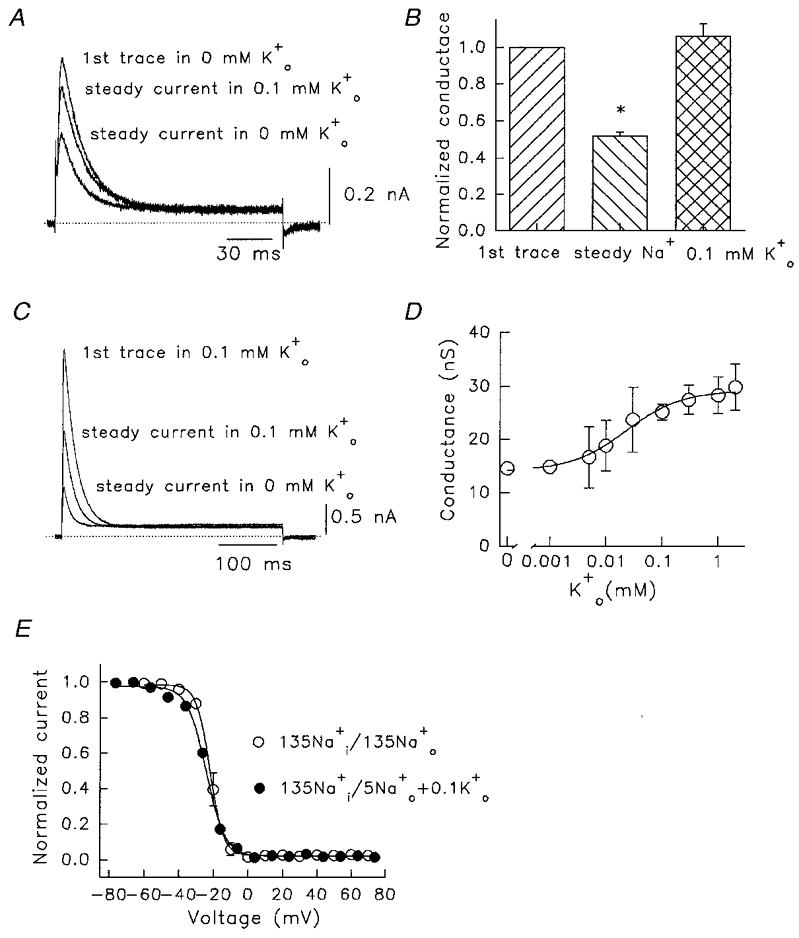
A, after a 1 min dialysis period, the cell was pulsed to +60 mV for 150 ms once every 60 s in 130 mM /5 mM . The first current trace, the trace after a steady state was reached (after 3 pulses), and that after subsequent addition of 0.1 mM are shown. Dotted line denotes zero current. B, mean data illustrating reduction of steady Na+ conductance during constant low rate pulsing (n = 5), and recovery induced by 0.1 mM (n = 6). The middle column is significantly different from both other columns (one-way ANOVA, * P < 0.01). C, reduction of use dependence by inclusion of 0.1 mM in the bath solution. The first current trace in 130 mM /5 mM + 0.1 mM , and the trace after a steady state was reached are shown. The smallest current was obtained after subsequent removal of . Pulses were to +60 mV every 60 s. D, amplitude of first pulse peak conductance as a function of . All data from pulses to +60 mV. For the Hill fit, the Kd was 23 μM and nH was 0.89. Plotted points are mean values from 3–18 observations. E, steady-state inactivation relationships in /, with and without 0.1 mM . In 135 mM /135 mM the V1/2 inactivation was -21.4 ± 1.6 mV and slope factor 3.4 ± 0.2 mV (n = 6), and in 130 mM /5 mM + 0.1 mM , the V1/2 was -24.1 ± 0.7 mV and slope factor was 5.6 ± 0.4 mV (n = 5). No significant differences were observed between the V1/2 and k values for the two relations.