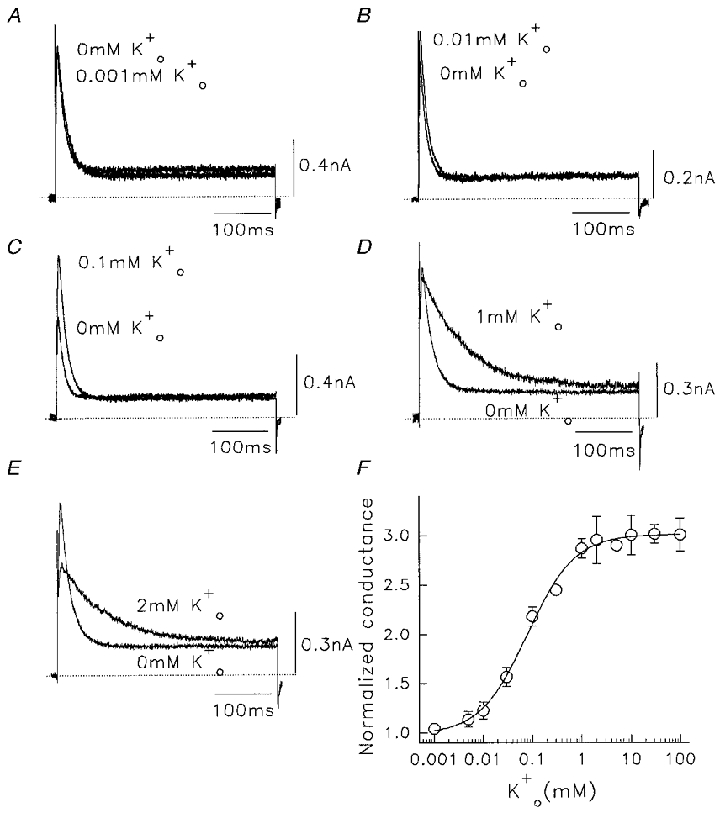
Figure 8. Effect of low concentrations of on outward Na+ currents through Kv1.5 channels.

In all cases control solutions were 130 mM /5 mM . A-E, current traces showing effect of addition of different extracellular K+ concentrations. The control trace is labelled 0 mM . Data were obtained at +60 mV, pulses were at 0.05 Hz. Dotted lines denote zero currents. F, relationship between normalized peak Na+ conductance in different added . Plotted points are from a mean of 4–12 cells in each case. From the Hill fit to data points, for added , the Kd was 0.08 ± 0.01 mM and nH was 0.9 ± 0.1.
