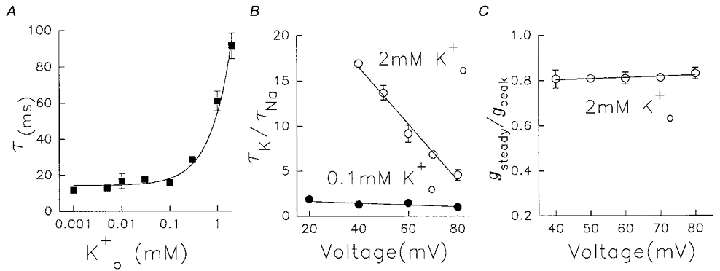
Figure 9. Concentration and voltage dependence of effects on Kv1.5 Na+ currents in 130 mM /5 mM .

A, time constants of current decay as a function of on a logarithmic scale. Data represent means ±s.e.m. (n = 4-12). B, ratio of decay time constant in K+-containing solution (τK) over that in K+-free solution (τNa) against depolarization voltage. •, 0.1 mM data (n = 5-8); ^, 2 mM data (n = 6–8, means ±s.e.m.). In both cases, before addition of , Na+ currents were at steady state induced by 400 ms pulses from -80 to +60 mV at 0.05 Hz. The straight lines fitted through the data had a slope of -0.01 for 0.1 mM and -0.3 for 2 mM . C, voltage dependence of use dependence of conductance in 2 mM . Cells were pulsed to a range of potentials at 0.05 Hz and steady current conductance was normalized to peak (first pulse) conductance (gsteady/gpeak). Different cells were used for each potential, n = 4–11.
