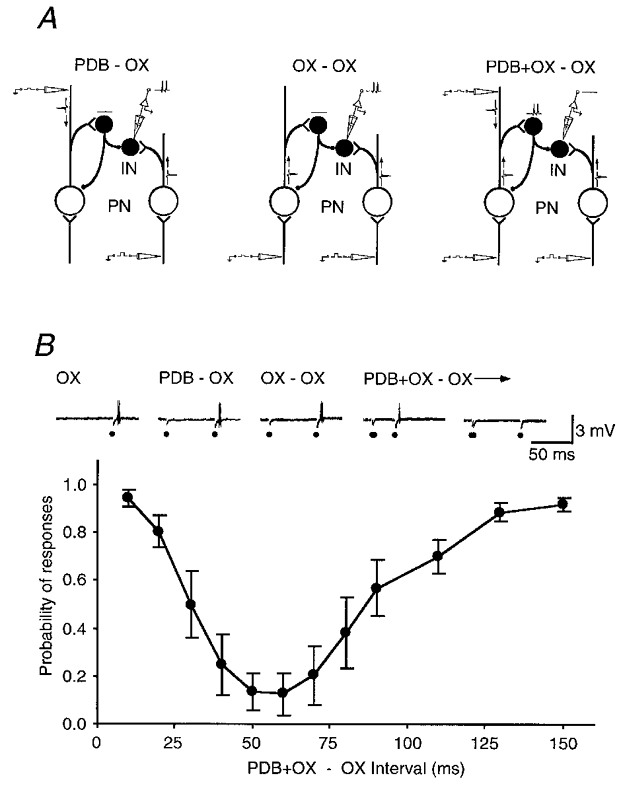
Figure 6. Depression of a burst-firing neuron after OX and PDB stimulation.

A, a schematic diagram shows the experimental design. Note that neither OX nor PDB stimulation alone at low intensity will block the suprathreshold OX stimulation-evoked responses, but together they will. IN, inhibitory burst-firing neuron; PN, PDB-projecting neuron. B, the ordinate shows the probability of a response to a test OX stimulation after a combination of conditioning OX and PDB stimulation at different intervals. The abscissa shows the interval between the conditioning and test stimulation. The data points are averaged from 4 cells and error bars show the standard errors of the mean. The recording traces on the top exemplify responses at two points on the curve recorded from one cell.
