
Figure 6. I–V relationships for various current components.
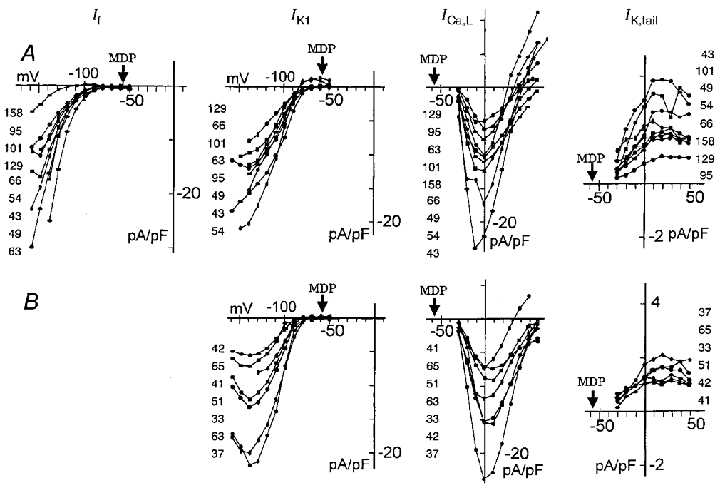
Upper panels (A) show I–V curves in the cells which showed If, and lower panels (B) show those cells which did not show If. The current components are indicated at the top of each column. The amplitude of If was determined as the time-dependent increase from the level at 30 ms after the onset of the test pulse to that near the pulse end. IK1, Ba2+-sensitive currents measured 30 ms after the pulse onset. The decrease of current amplitude beyond -130 mV is most probably due to the ionic block of the channel. ICa,L, the amplitudes measured from the current level at 100 ms to the peak of transient inward current. IK,tail, peak current values of the outward tail current on repolarization. The current density (pA pF−1) was determined by dividing the current amplitude by the cell capacitance (pF); these values are indicated for each I–V relationship on the left (or right in IKtail) approximately in order of increasing current amplitude. MDP, average maximum diastolic potential of -57.3 mV.