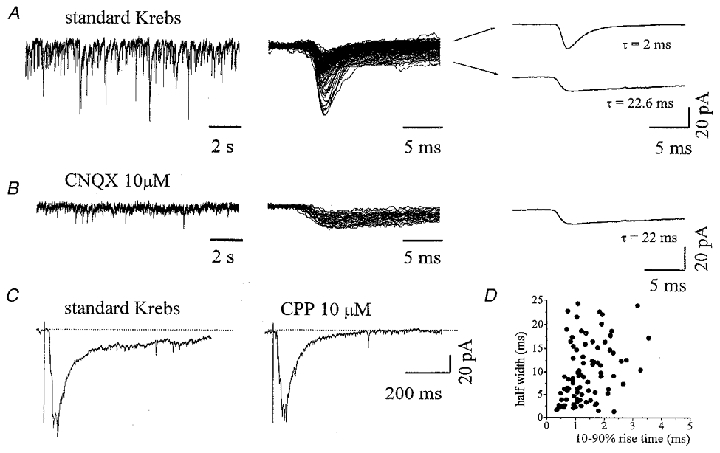
Figure 1. Spontaneous and evoked activity from a ventral interneuron in an untreated culture.

A, spontaneous synaptic activity from a ventral interneuron is composed by inward currents of variable amplitude (left); single PSCs comprise events with fast or slow decay times (middle, superimposed tracings). Rise time and decay time are measured from the fast PSC average (top right: rise time = 0.8 ms, τ = 2 ms) and the slow PSC average (bottom right: rise time = 1.1 ms, τ = 22.6 ms). B, application of CNQX (left, same cell as in A) completely blocks all fast events and leaves only slow ones (middle, superimposed traces). Kinetics are measured from the average of slow decay events (right, rise time = 1.5 ms, τ = 22 ms). C, synaptic currents evoked in the same interneuron as in A and B by DRG stimulation are shown in standard Krebs (left) and in the presence of CPP (right); each panel represents the average of 7 consecutive evoked PSCs. Note that the application of CPP reduces the area subtended by the evoked PSC by 38 %. Dotted lines indicate the baseline. D, scatter plot of rise time versus half-width (same cell as in A); regression analysis reveals no linear relationship between these two parameters (r2 = 0.006, Pearson correlation coefficient = 0.07).
