
Figure 4. Spontaneous and evoked activity from ventral interneurons in cultures chronically treated with TTX.
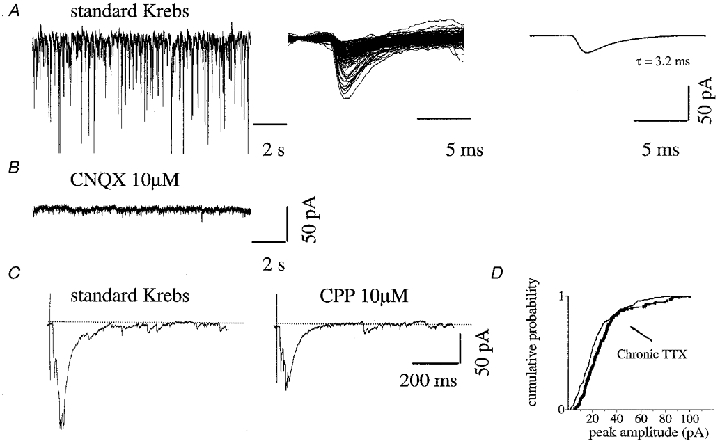
A, left, example of spontaneous activity recorded from an interneuron in a chronically TTX-treated culture; middle, superimposed events: only fast decay events are detected; right, from their average, rise time (0.9 ms) and τ (3.2 ms) values are measured. B, addition of CNQX blocked all fast events leaving no residual activity (same cell as in A C,). evoked PSCs elicited by DRG stimulations are shown in standard Krebs solution (left) and in the presence of CPP (right); dotted line represents the baseline current. CPP produced a 44 % reduction in the of the evoked PSC. Each panel represents the average of 5 consecutive evoked PSCs (different cell from A and B). D, cumulative distribution plot for PSC data obtained after chronic TTX treatment or in control shows no statistically significant difference.