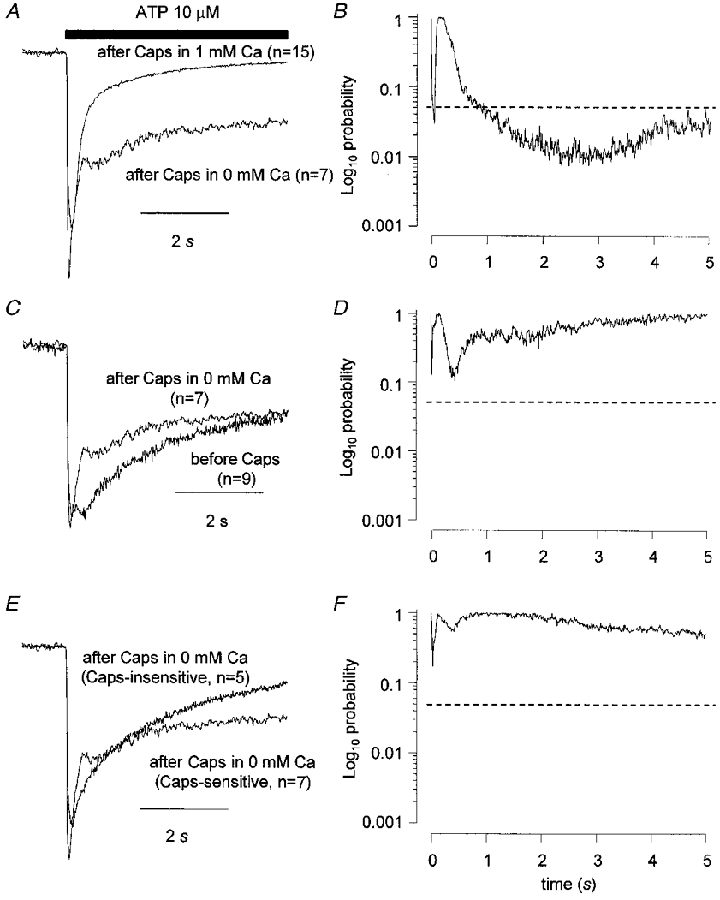
Figure 5. Cross-desensitization between ATP and capsaicin in DRG neurones is Ca2+ dependent.

The records in A, C and E show the averaged, normalized current to ATP (10 μM) obtained when ATP was applied to capsaicin-sensitive cells after capsaicin but capsaicin was applied in Ca2+-free solution. In A the data are compared to the equivalent data from cells where capsaicin was applied in normal Ca2+-containing solution. In C the data are compared to the ATP response obtained before capsaicin was applied in capsaicin-sensitive cells. In E the data are compared to the ATP response obtained after capsaicin was applied in the absence of Ca2+ but to capsaicin-insensitive cells. The data in B, D and F are plots of probability values obtained from unpaired t tests applied at 10 ms intervals comparing the current traces in A, C and E, respectively. The horizontal, dashed lines in B, D and F indicate a value of P = 0.05. Vh was −60 mV.
