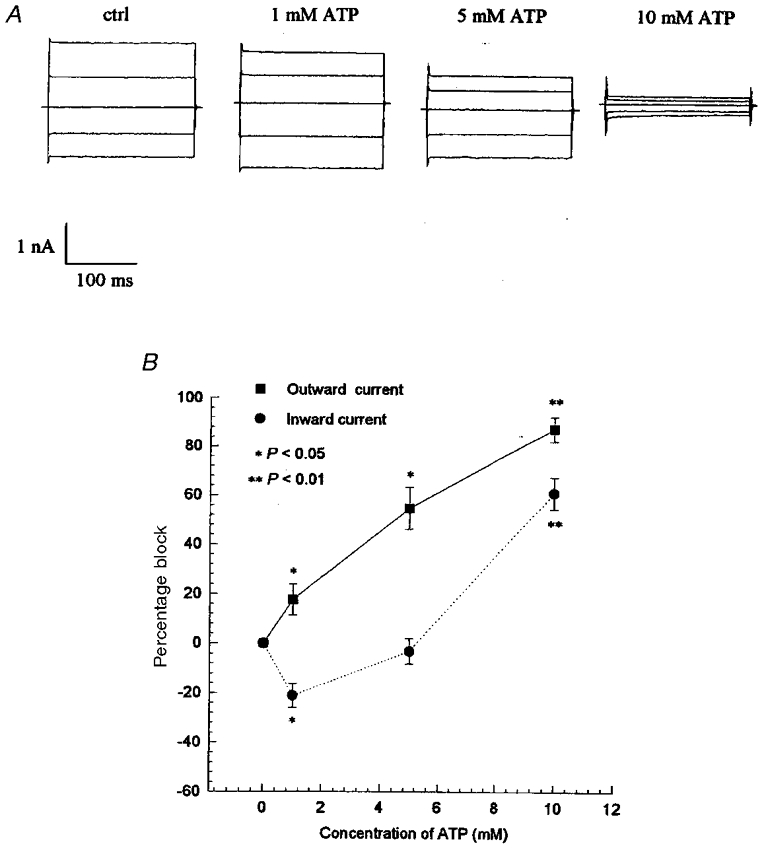
Figure 1. Effects of ATP on the hypotonic-induced currents.

After the chloride currents were activated by hypotonic solution for 7 min, the hypotonic bath solution was changed to hypotonic solution containing 0 (ctrl, n = 5), 1 mM (n = 6), 5 mM (n = 4) and 10 mM ATP (n = 5), and then changed back to isotonic bath solution 10 min after ATP treatments. A, the typical whole-cell current traces of the volume-activated currents under different treatments in the NPCE cells cycled through the 200 ms voltage steps (±40, 0, ±80 mV; 4 s interval). B, the percentage inhibition of mean outward (induced by a +80 mV step) and inward currents (induced by a −80 mV step) activated by hypotonic solution. The data represent the means ±s.e.m. of the number of experiments indicated above.
