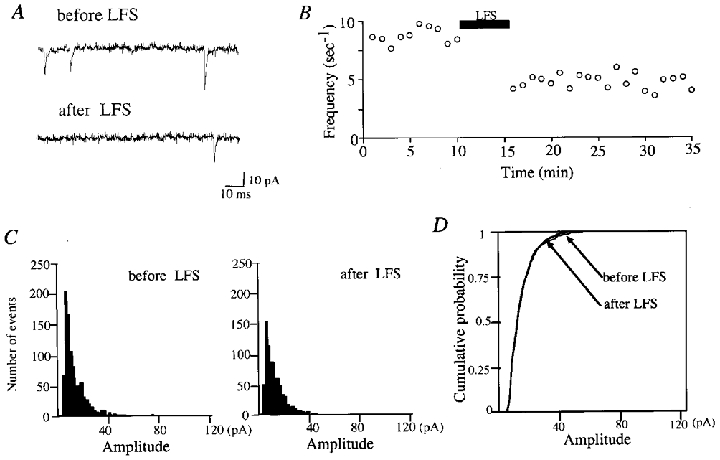
Figure 3. Decrease in the frequency of mEPSCs but not in their amplitude after LFS.

A, representative traces with spontaneous events before and after LFS. The lower trace was recorded 18 min after LFS. B, time course of frequency of mEPSCs. The frequency was measured every 60 s. LFS was applied during the period indicated by the horizontal bar. C, amplitude distribution of mEPSCs just before (left) and 18–20 min after (right) LFS. The total number of events in the left and right histograms is 950 and 720, respectively. D, cumulative plots of the amplitude distribution shown in C. Cumulative probability along the ordinate indicates the probability of observing mEPSCs with peak amplitudes smaller than or equal to a given value.
