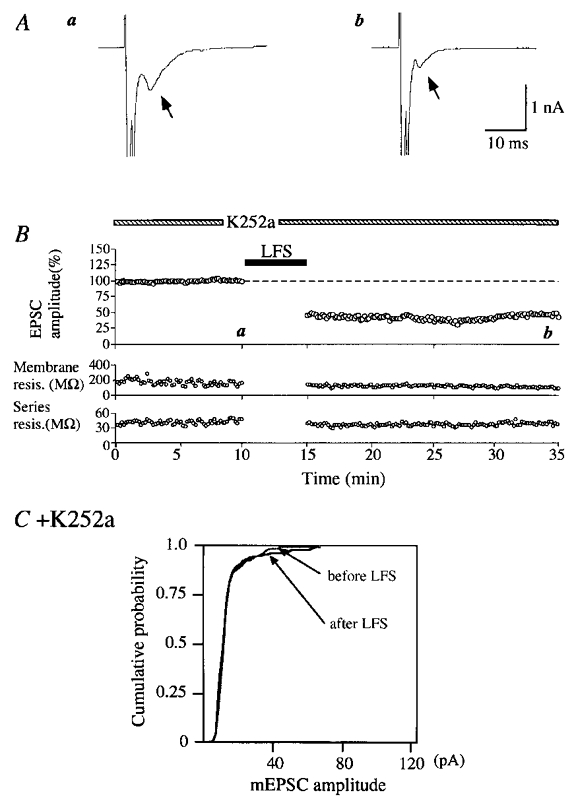
Figure 5. Induction of LTD without changes in the amplitude of mEPSCs during the application of K252a.

A, an example of autaptic EPSCs recorded at the time point indicated by corresponding letters in the upper graph in B. Other conventions are the same as in Fig. 2A. B, peak amplitudes of EPSCs plotted against time (top). The application of K252a at a concentration of 200 nM was started 20 min before the initiation of the recording. Other conventions are the same as in Fig. 2B. C, cumulative plots of the amplitude distribution of mEPSCs just before and 15–20 min after LFS. Other conventions are the same as in Fig. 3D.
