
Figure 7. Properties of the connections between basket (A) or axo-axonic cells (B) and pyramidal neurones.
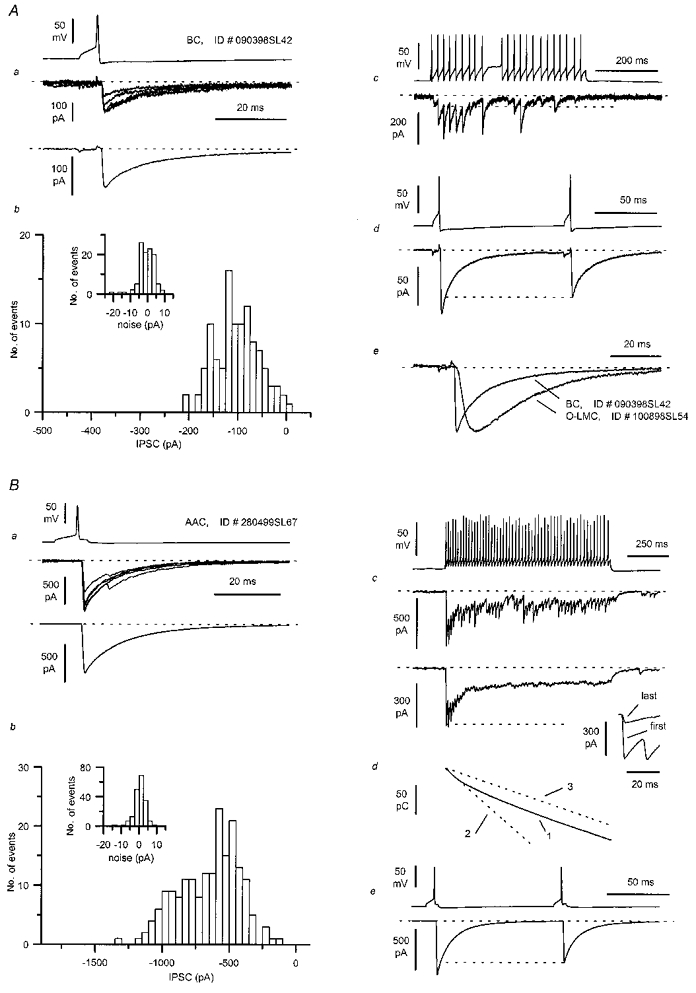
Aa, single action potentials evoked in a BC (see also Fig. 8E and F) of a P14 rat are followed by uIPSCs in the postsynaptic neurone (single sweeps and average from n = 86 traces). Ab, amplitude distribution of the uIPSCs (n = 107) and the recording noise (inset). Ac, firing pattern and postsynaptic effect during a long train of action potentials evoked by depolarising current (200 pA amplitude 500 ms duration). Note the lack of action potential accommodation and the abrupt period of silence during the train. There is a decline in IPSC amplitude during the train with apparent response failures. The dashed lines mark the baseline current level and the peak of the first IPSC of the train. Ad, paired-pulse depression is elicited by two action potentials separated by 100 ms. Ae, comparison of the kinetics of the averaged IPSC recorded from the O-LM cell connection shown in Fig. 1, and the one shown in Aa. The IPSCs were scaled to the same peak amplitude and superimposed. Note the much longer time to peak of the IPSC evoked by the O-LM cell in comparison with that of the basket cell. Ba, unitary events recorded from a pyramidal cell following single action potentials evoked in an AAC (single sweeps and average of 187 traces). Bb, peak amplitude distribution of the uIPSC and noise (inset) of the same connection (n = 187 records). Bc, summated IPSCs evoked by a long train of action potentials, triggered by a 200 pA amplitude, 1 s duration current step; a single sweep (top) and the average of 32 traces are shown. Dashed lines mark the baseline current level and the peak amplitude of the first IPSC. The average IPSCs evoked by the first and last action potentials of the train are compared in the inset on the right after aligning their offset. Bd, charge transfer calculated from the average summated IPSC (trace 1). Notice the different slope during the first 100 and last 500 ms of the spike train. Linear fits of these two time windows are clearly divergent (dashed lines 2 and 3, respectively, line 3 shifted to IPSC onset). Be, depression of the second response was evoked by two action potentials at 100 ms interspike interval.