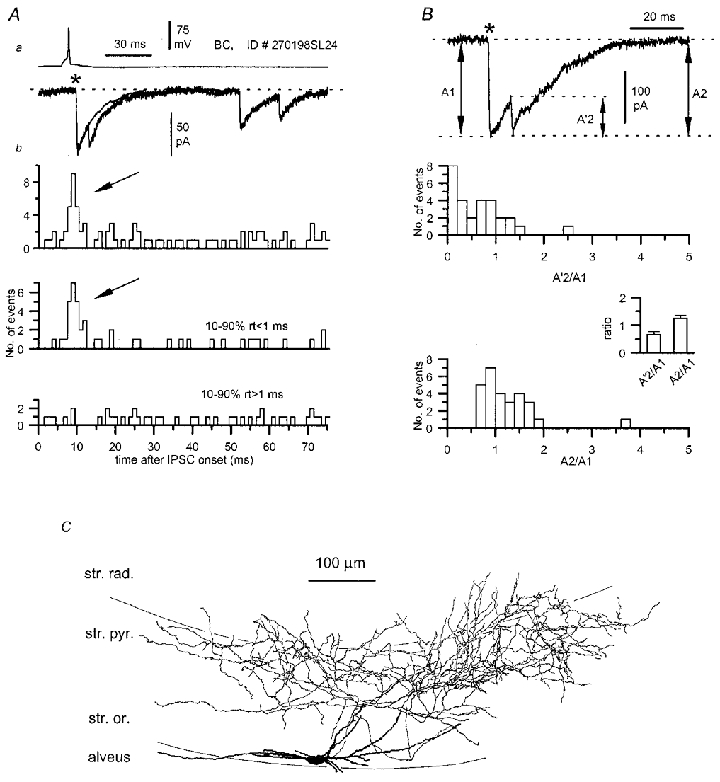
Figure 9. Multiphasic uIPSC evoked by a CCK-immunopositive basket cell (see also Fig. 10) in a pyramidal cell at P15.

Aa, a single action potential generated ‘complex’ uIPSC is compared to the average kinetics of monophasic responses from the same connection. Ab, the distribution of secondary events following the onset of the uIPSC (0, as asterisk in a) is shown for all secondary events (top plot) and for events with fast (<1 ms, middle plot) or slow (>1 ms, bottom plot) rise times. Note that fast rising secondary events are clustered immediately following the uIPSC (arrows). B, amplitude ratios of the asynchronous events. Amplitude ratios were calculated either using the amplitude of the secondary events measured from their onset (A'2) or from the baseline (A2). The distribution for the A'2/A1 ratio and the mean ratio (inset) show that the secondary events had a smaller amplitude than the first ones. The distribution for the A2/A1 ratio and the corresponding mean ratio (inset) show that the absolute peak amplitude levels of first and secondary events were similar. C, reconstruction of the presynaptic basket cell of this pair, identified on the basis of the dense innervation of str. pyramidale. The dendrites are restricted to str. oriens/alveus and oriented mainly parallel with the layers.
