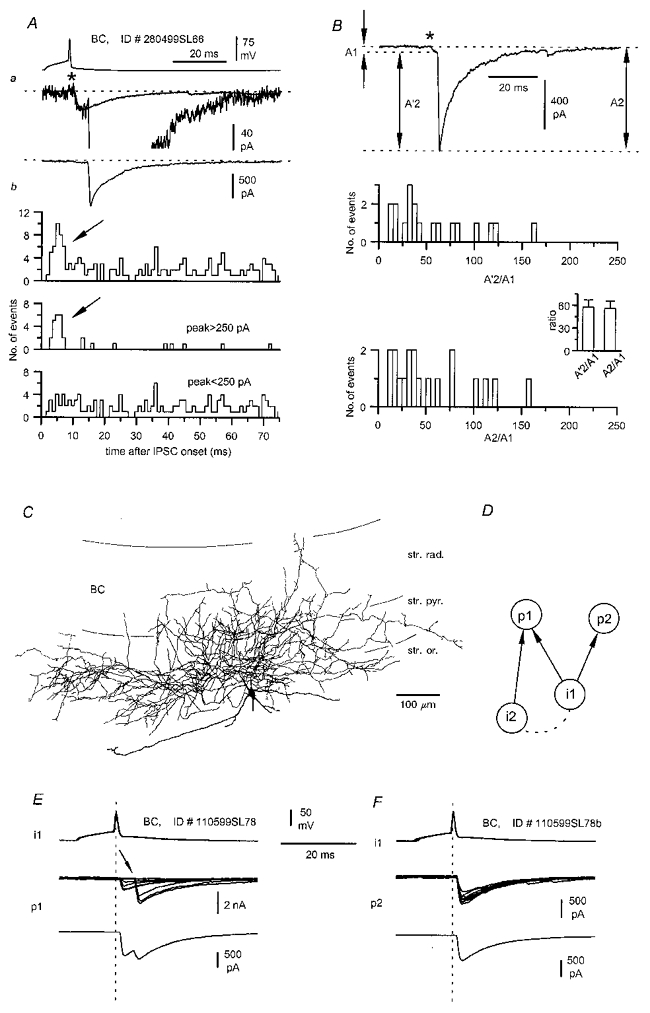
Figure 11. ‘Complex’ IPSCs evoked by basket cells may be the result of network interactions.

Aa, multiphasic uIPSCs (middle and lower traces, same record at different scales) evoked by a single spike in the presynaptic interneurone (upper trace). Note the small uIPSC preceding the much larger secondary event; the average kinetics for monophasic IPSC from the same connection are superimposed on the single sweep. Ab, the distribution of secondary events following the onset of the first IPSC (asterisk) is shown for all secondary events (top plot) and for events with large (peak > 250 pA, middle plot) or small (peak < 250 pA, bottom plot) amplitudes. Large secondary events are more frequent immediately following the uIPSC (arrows). B, amplitude ratios of the large (>250 pA) asynchronous events occurring in the 0–10 ms time window. Ratios were calculated either using the amplitude of the secondary events measured from their onset (A'2) or from the baseline (A2). The distribution for the A'2/A1 ratio and the mean ratio (inset) show that the secondary events had a much larger amplitude than the first ones. The distribution for the A2/A1 ratio and the corresponding mean ratio (inset) show that the absolute peak amplitude levels of first and secondary events were very different. C, reconstruction of the presynaptic basket cell shown in A and B and identified on the basis of its postsynaptic target domains (Table 2). Note the relatively wide distribution of the axon to different layers. D, schematic diagram of a possible network circuit underlying ‘complex’ IPSCs. Synaptic connections are indicated by arrows, putative gap junction, or other form of interneuronal interaction by dashed lines. E and F, postsynaptic effect of a single presynaptic basket cell (i1) onto two distinct pyramidal neurones recorded sequentially (p1 and p2) at P14. Notice that ‘complex’ IPSCs (single sweeps and average of 22 and 245 traces, respectively) evoked by a single spike can be recorded only from one (p1) of the two postsynaptic pyramidal cells. Vertical dashed lines are shown for reference.
