
Figure 12. Presynaptic cell-specific rise times of unitary IPSCs.
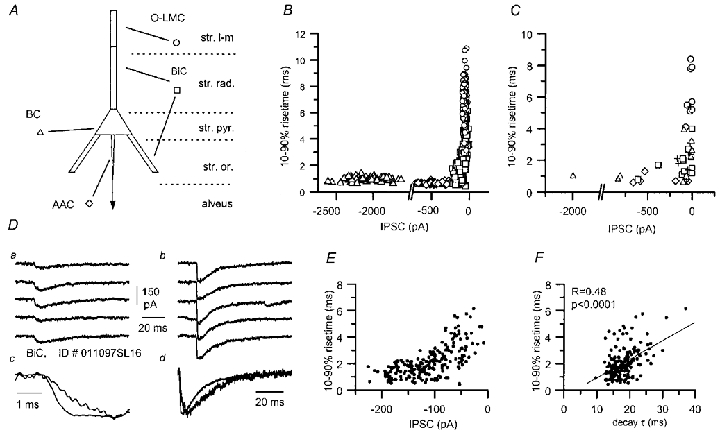
A, scheme of the different postsynaptic compartments of pyramidal cells and their selective targeting by specific interneurones. B, relationship of uIPSC rise time and amplitude. IPSCs (single sweeps) evoked by four distinct interneurones are plotted: an AAC (diamonds), a BC (triangles), a BiC (squares) and an O-LMC (circles). C, similar plot obtained from the average unitary IPSC of all connections studied (AAC, n = 7; BC, n = 9; BiC, n = 13; O-LM, n = 8). Symbols are as in A, and in addition, the effects of unidentified presynaptic interneurones are marked by crosses. The properties of responses evoked by a given cell type tend to differ from all other cell types. D, comparison of selected sweeps from a BiC to pyramidal cell connection (P12) showing variability of uIPSC kinetics. Slower and smaller (a) as well as faster and larger (b) responses were observed. Averages of the 5 traces (c and d) are shown scaled to the same peak amplitude at two different time scales. E, the relationship of IPSC rise time and amplitude for the same BiC to pyramidal cell connection shows a biphasic distribution of IPSCs. F, the IPSC decay to rise time relationship of the same responses showed a significant correlation.