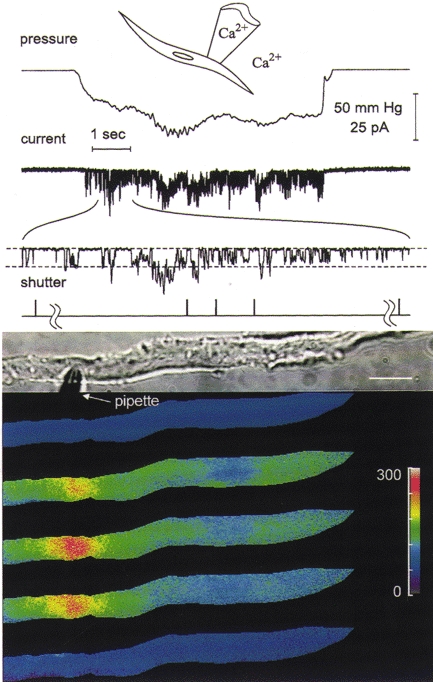
Figure 1. Stretch-induced opening of stretch-activated channels in a localized region of the membrane causes both global and focal increases in [Ca2+]i.

Images of [Ca2+]i from fura-2 AM-loaded cells were obtained using a UV laser-illuminated digital imaging microscope (Isenberg et al. 1996). The drawing at the top of this and the next three figures depicts the recording configuration and whether Ca2+ was present in the pipette or bathing solution. The traces shown above the images are from top to bottom: the output of a pressure transducer indicating the level of negative pressure or suction applied to the patch pipette, the stretch-activated channel currents obtained by application of suction to the patch pipette with an expanded ≈1 s section of the record below, and trigger pulses from the laser shutter(s) indicating when the images were obtained. To help follow the decline in unitary current amplitude with channel activity, dashed lines in the expanded section of the current trace are used to indicate the baseline and unitary current amplitude for the channels opening at the beginning of the expanded trace. The images of [Ca2+]i were obtained as previously described (Isenberg et al. 1996) and pseudocoloured, with the colour bar providing a linear scale for [Ca2+]i from 0 to 300 nM. A transmitted light image of the cell and pipette are shown above the pseudocoloured images (scale bar, ≈15 μm). A pair of dual wavelength images was acquired shortly before the onset of suction and the resting [Ca2+]i set to a value of 50 nM to give the top pseudocoloured image. Three sequential pairs of images were obtained during the application of suction, and a final pair of images was obtained approximately 30 s after cessation of suction and was used to generate the pseudocoloured image at the bottom. The hash marks in the shutter trace are used to set off the shutter pulses for the pair of images before the onset and after the cessation of suction. For this experiment the patch membrane potential was set to 100 mV more negative than the resting potential. The format used here is similar to the format used for the next four figures.
