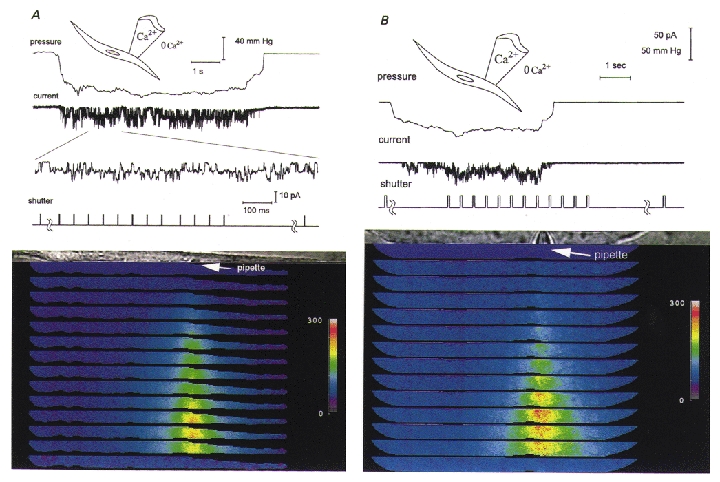
Figure 3. Only a focal increase in [Ca2+]i occurs when stretch-activated channels open and Ca2+ is present in the pipette solution but the bathing solution is Ca2+ free (0 Ca2+, 0.2 mM BAPTA).

In order to follow [Ca2+]i changes with greater time resolution both during and after cessation of membrane stretch, the optics of the digital imaging microscope were reconfigured to allow the rapid acquisition of 12 rather than 3 image pairs by dividing the charge coupled device chip so that each of the images shown subtended an area of the field that is 150 mm × 6 μm rather than 150 mm × 22 μm as in Figs 1 and 2. In all other respects except for the absence of Ca2+ in the bathing solution, this experiment is similar to that depicted in Fig. 1, with the colour bars providing a linear scale for Ca2+ from 0 to 300 nM. Panels A and B are from two different cells. For panel A the set of images was taken from the time the channels opened, while for panel B the images were taken sometime after the channels opened but also during the period of time after channel activity ceased. Note in panel B the longer delay in the [Ca2+]i increase after the onset of channel activity and the increase in [Ca2+]i after membrane stretch and stretch-activated channel activity ceased (see text).
