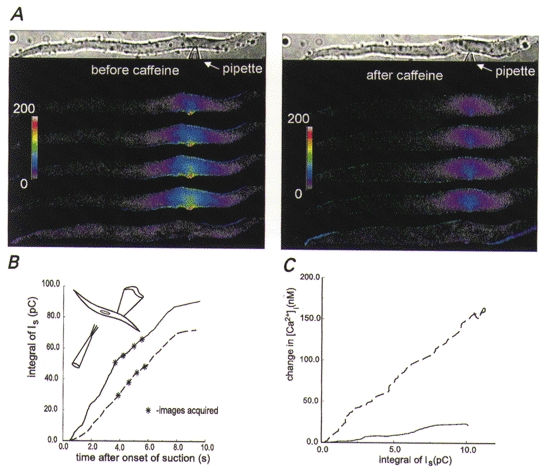
Figure 5. When the cell is treated so as to deplete Ca2+ from internal stores, the focal changes in [Ca2+]i resulting from opening of stretch-activated channels are diminished.

A, pseudocoloured images of changes in [Ca2+]i obtained by local stretching of the membrane of a smooth muscle cell before (left panel) and about 2 min after (right panel) caffeine (20 mM) was applied to the cell to induce Ca2+ release from stores. The cell was bathed in the usual solution except that it was devoid of Ca2+ (0 Ca2+, 0.2 mM BAPTA) but contained 100 nM thapsigargin to block reuptake of Ca2+ by the sarcoplasmic reticulum Ca2+ pumps. The pipette solution contained physiological levels of Ca2+. In order to facilitate comparisons of the responses to membrane stretch, the increment in [Ca2+]i above pre-stretch levels is displayed. As expected, this cell contracted transiently in response to the release of Ca2+ induced by caffeine. When the cell re-extended and the [Ca2+]i returned to resting levels, the patch of membrane was again stretched to produce the images on the right, now with the stores presumably depleted, showing a diminished focal change in [Ca2+]i. The optical configuration was as in Fig. 1 except for the addition of a liquid-filled light guide, and the experimental configuration is shown in the inset in B. The colour bar provides a linear scale for the change in [Ca2+]i from 0 to 200 nM. B, time course of the cumulative (integrated) stretch-activated currents for the cell shown in A. The dashed and continuous lines show the integrated stretch-activated channel currents (total charge influx) before and after caffeine application, respectively. Note that even though the integrated current induced by membrane stretch is slightly greater after caffeine application, the [Ca2+]i changes are smaller. C, prolonged exposure of a different smooth muscle cell to a Ca2+-free bathing solution decreases the change in [Ca2+]i due to stretch-activated current. The dashed and continuous curves show, respectively, the relationship between the cumulative stretch-activated current and changes in [Ca2+]i observed after 5 and 30 min of exposure to a Ca2+-free bathing solution containing 200 μM BAPTA. The vertical distance between the curves at any point along the x-axis represents the decrease in the change in [Ca2+]i due to a given total charge influx, presumably because of the gradual loss of store amplification. Ca2+ was present at the usual levels in the patch pipette solution. [Ca2+]i changes were recorded from a 30 μm long region of the cell centred around the patch pipette using the FDWM at a frequency of 150 Hz throughout the 3.2 s that the membrane was stretched.
