
Figure 2. Light-induced potentiation of NMDA-induced currents is reversible.
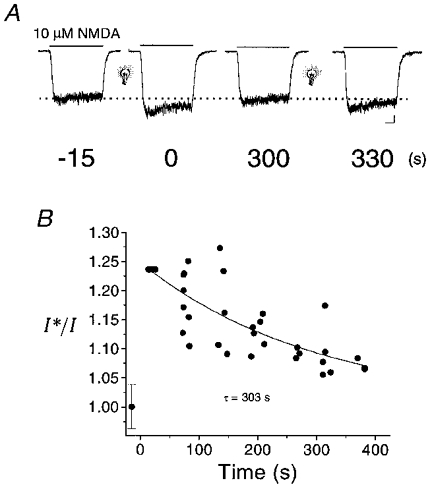
A, NMDA (10 μM)-elicited responses in a neurone before and several times after exposure to light. Numbers under the traces represent the elapsed interval (in seconds) before and following the initial flash (600 ms, > 280 nm; light bulb). A second light stimulus was given after 300 s. B, peak response amplitudes for traces such as those shown above were measured in a total of 8 cells and plotted relative to the pre-flash response amplitude (I*/I) with respect to the post-flash interval. A single exponential function was fitted to the data to estimate the time constant (τ) of the reversal of the effect of light on the NMDA response. Scale bars below right-hand trace in A represent 100 pA and 1 s.