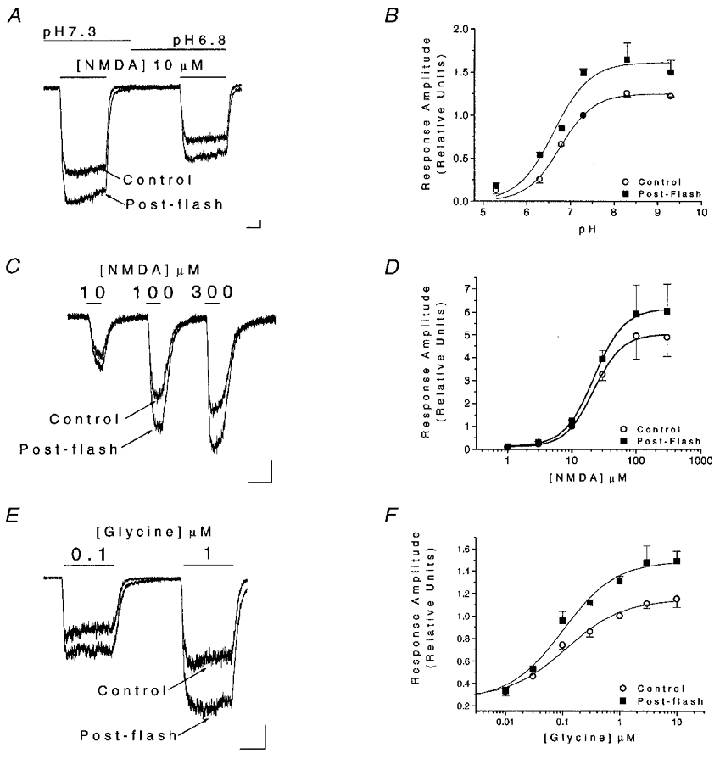
Figure 5. Proton, NMDA and glycine sites are not affected by light stimulation.

A, whole-cell currents in cultured cortical neurones elicited by 10 μM NMDA at two different extracellular pH values (7.3 and 6.8) obtained before and shortly after a light stimulus (2 s, > 280 nm). B, data such as those shown in A were obtained at extracellular pH values ranging from 5.3 to 9.3 and normalized to the pre-flash response recorded at pH 7.3. Data from a total of 22 cells were fitted with logistic functions to estimate the pK of proton inhibition before (6.8 ± 0.1) and after (6.8 ± 0.1) light stimulation. The logistic function used has the form Y = {[a -d]/[1 + (X/c)b]} +d, where Y is the response, X is the pH (or drug concentration), a is the response when X = 0, d is the response for an infinite dose, c is the pK (or EC50) and b is the ‘slope factor’, which determines the steepness of the curve and is analogous to the Hill coefficient (DeLean et al. 1978). No parameters were fixed in these fits. C, whole-cell currents elicited by increasing concentrations of NMDA (10, 100, 300 μM) in the presence of 10 μM glycine in neurones before and shortly after light stimulation (2 s, > 280 nm). D, data such as those shown in C were obtained at a range of NMDA concentrations between 1 and 300 μM in a total of 18 cells, and normalized to the pre-flash 10 μM NMDA-induced response. The resulting concentration-response relationships were fitted with logistic functions (no fixed parameters) to estimate the agonist EC50 before (21.9 ± 1.5 μM) and after (22.8 ± 0.3 μM) the flash. The ‘slope factors’ were also similar before and after the flash (1.9 and 1.8). E, whole-cell currents elicited at two concentrations of glycine (0.1 and 1 μM) in the presence of 100 μM NMDA in neurones before and shortly after photostimulation (2 s, > 280 nm). F, data such as those shown in D were obtained at a range of glycine concentrations between 0.01 and 3 μM in a total of 18 cells, and normalized to the pre-flash 1 μM glycine-induced response. The resulting concentration-response relationships were fitted with logistic functions to estimate the agonist EC50 before (115.1 ± 27.6 nM) and after (101.4 ± 24.6 nM) the flash. The ‘slope factors’ were the same for both fits (0.9). For these logistic functions a was fixed to Y when X = 0.01 μM as the background glycine concentration has been estimated to be within this range. All scale bars represent 150 pA and 1 s.
