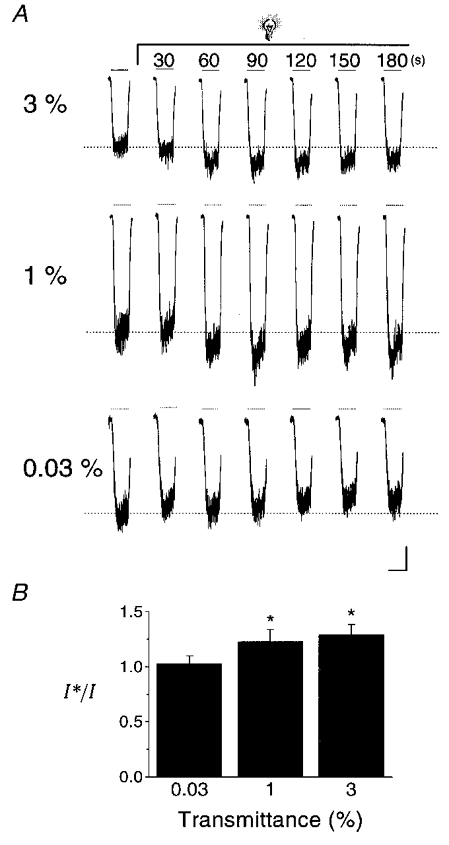
Figure 6. Potentiation of NMDA receptor-mediated currents by light at physiological intensities.

A, NMDA (10 μM)-elicited responses in cortical neurones before and during continuous light stimulation with light attenuated by neutral density filters. NMDA applications are represented by the lines above the traces. The transmittance (%) of non-attenuated light (0.09 μW μm−2 at 404 nm; see Methods) is indicated to the left of each set of traces. Time records above the traces represent the time elapsed since the initiation of the flash. B, peak response amplitudes for traces such as those shown above were measured in a total of 3–4 cells per filter and plotted relative to the pre-flash response amplitude (I*/I). A one-way analysis of variance followed by Tukey's multiple comparison tests revealed a significant difference between 0.03 % transmittance and the 1 % and 3 % transmittance groups (*P < 0.05). Scale bars: 100 pA, 2 s.
