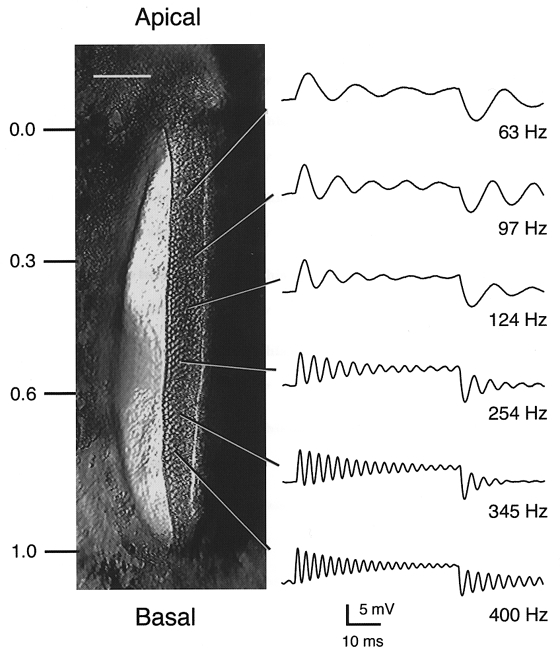
Figure 1. Tonotopic organization of the turtle basilar papilla.

Left, surface view of the basilar papilla during an experiment showing the epithelial strip of hair cells on the right-hand side, apical (lagenar) end at the top and basal (saccular) end at the bottom. Scale bar, 100 μm. Fractional distance (d) from lagena end shown on left. Most of the measurements of the buffer effects were taken at values of d of approximately 0.3 or 0.6. Right, examples of electrical resonance recorded in hair cells at the locations indicated. Each record is the response to 25 presentations of a small depolarizing current step evoking oscillations in membrane potential at the start and end of the step. Recordings were obtained with electrodes containing 0.1 or 1 mM BAPTA as the calcium buffer. For some of the cells, the resting potential was about -70 mV, and thus the current step was superimposed on a standing current to depolarize the cell into the range where tuning was optimal. Resonant frequencies are given next to traces. Membrane potentials prior to current step: -51 mV (63 Hz), -47 mV (97 Hz), -47 mV (124 Hz), -39 mV (254 Hz), -44 mV (345 Hz) and -44 mV (400 Hz).
