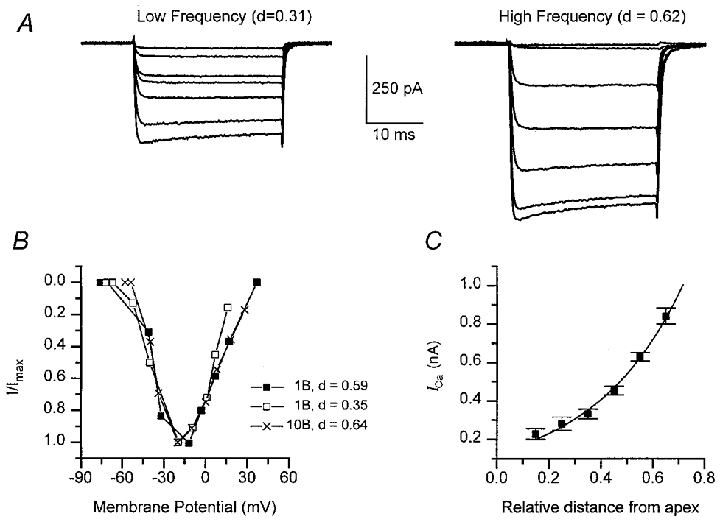
Figure 2. Variations in peak Ca2+ current with hair cell location.

A, voltage-dependent Ca2+ currents in hair cells at a low-frequency position (d, the distance along papilla, 0.3) and a high-frequency position (d = 0.6). Average currents recorded with Cs+-filled electrodes for depolarizations from -80 mV, 1 mM intracellular BAPTA. Membrane potentials during steps were (mV): -55, -50, -45, -42, -40, -31, -21 (low-frequency cell) and -51, -49, -40, -38, -33, -20, -10 (high-frequency cell). Each current response is the average of 5–25 stimuli. B, examples of steady-state current-voltage relationships for the Ca2+ current in three other cells with different internal BAPTA concentration, currents scaled to peak values. Peak currents and cochlear location, d:□, 1 mM BAPTA, 0.44 nA, d = 0.35; ▪, 1 mM BAPTA, 0.78 nA, d = 0.59; ×, 10 mM BAPTA, 1.04 nA, d = 0.64. C, plot of the peak Ca2+ current (ICa) against hair cell distance (d) from the apical end of the papilla. Each point is the mean ± 1 s.e.m of at least nine measurements in a 100 μm long region. Smooth curve: ICa=ICa(0) exp(d/λ), with ICa(0) = 0.13 nA and λ= 0.35, where λ is the space constant.
