
Figure 1. The variance-mean analysis technique.
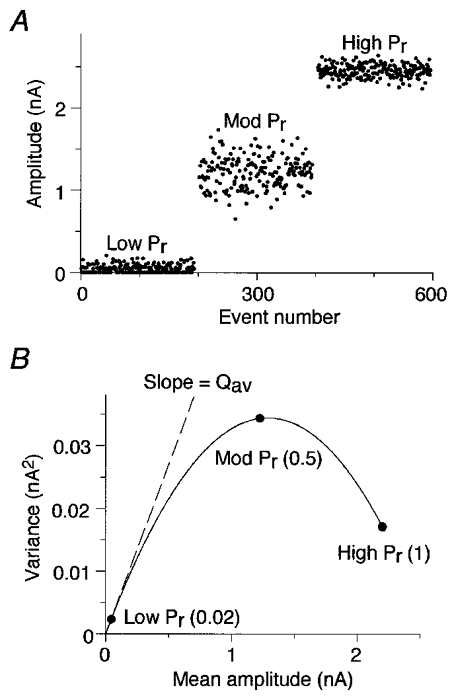
A, a series of simulated EPSC peak amplitudes were plotted against event number. The model assumed release probability (Pr) was uniform across 50 independent release sites and average quantal amplitude (Qav) was 50 pA at each site. Pr was set to three different values during three separate epochs, each of 190 events: Low Pr, 0.02; Mod Pr, 0.5; and High Pr, 1.0. B, the variance of the EPSC amplitudes was plotted against the mean amplitude for each epoch. The variance-mean plot was then fitted with a parabola. The initial slope of the fitted curve provides an estimate of Qav, and the parabolic function estimates Pr and the number of release sites (N).