
Figure 4. Relationship between Pr and paired-pulse ratio varies between neurons.
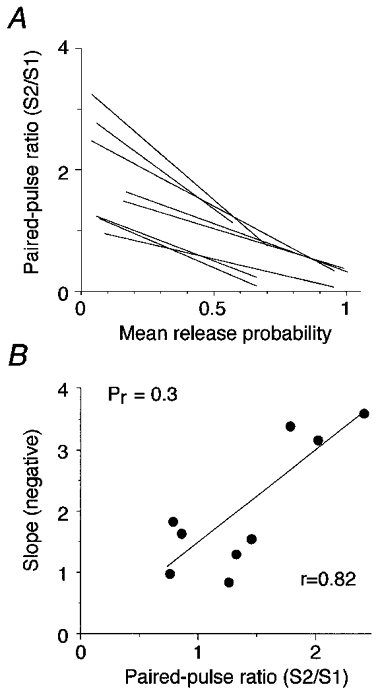
A, relationship between Pr and paired-pulse ratio for all neurons. For a given Pr value, some neurons show PPF while others show PPD. The slope of the linear fit between Pr and the paired-pulse ratio varied between neurons. B, direct relationship between the slope of the linear relationship and the paired-pulse ratio. The slopes of the linear fits in A were plotted against the paired-pulse ratio for a particular release probability (Pr= 0.3).