
Figure 11. Correlations between inhibitory cell firing and population activity.
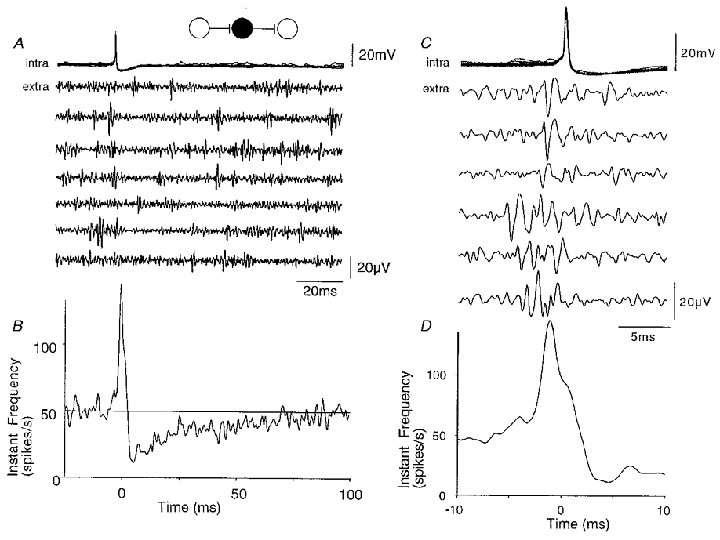
A, ten superimposed action potentials from a spontaneously active CA3 inhibitory cell and simultaneous extracellular records. Unit activity is reduced following the intracellular action potential. B, instantaneous frequency of extracellular activity triggered with respect to the intracellular spike (time t = 0; n = 1600 sweeps). Population activity was reduced to a minimum of about 30 % of its control level at about 4 ms after the inhibitory cell spike, and returned to control with time constant near 30 ms. The frequency of extracellular activity reached a peak before the inhibitory cell action potential. C, extracellular events, probably deriving from several distinct units, preceded inhibitory cell firing. D, the instantaneous frequency function shows that the increase in extracellular activity started at about 6 ms before and reached a peak at 2 ms before inhibitory cell action potentials.