
Figure 7. Temperature dependence of the α4β2 and α3β4 relaxation currents.
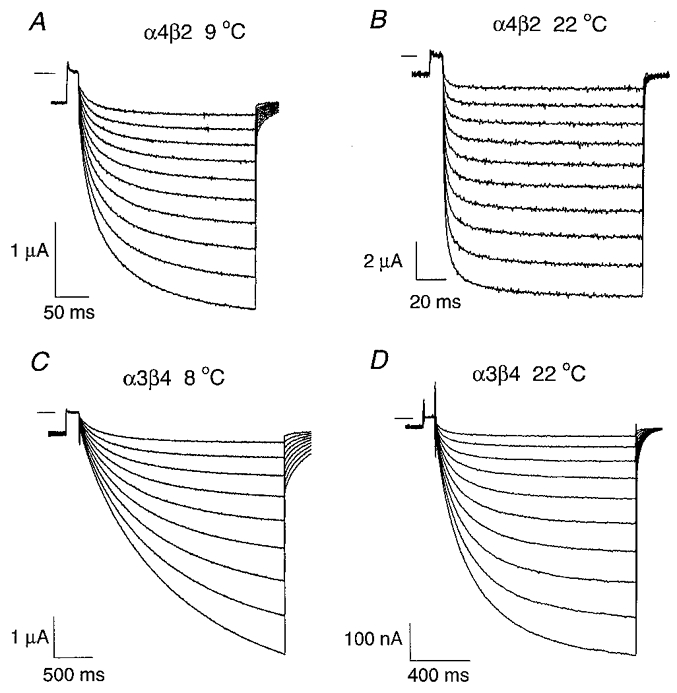
A-B, the traces are ACh-induced α4β2 relaxation currents at 9 °C (A) and at 22 °C (B). [ACh]= 100 nM. The relaxation currents were generated with a command voltage protocol (not shown) similar to that used in Fig. 1. Following a prepulse from -50 to +50 mV, the potential was jumped to a voltage between -60 and -150 mV (in 10 mV increments) and then jumped back again to -50 mV. The short horizontal line near the upper left corner of each set of traces denotes zero current. C-D,α3β4 relaxation currents at 8 °C (C) and 22 °C (D). [ACh]= 1 μM. The voltage protocol was the same as in C–D as in A–B but the jump duration was increased to compensate for the slower α3β4 relaxation time constants.