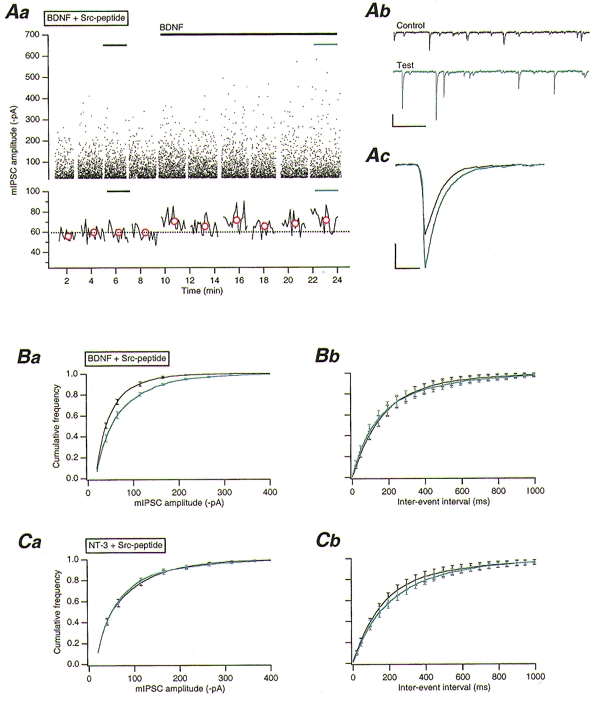
Figure 1. An interaction between TrkB and Src enhances GABAA receptor-mediated mIPSC amplitudes.

Aa, upper panel: plot of mIPSC amplitudes against time, with Src-peptide (1 mM) and orthovanadate (100 μM) included in the intracellular solution. BDNF (50 ng ml−1) application is indicated by the long black bar. The short black and blue bars in both the upper and lower panels indicate those data sets from which the mIPSCs illustrated in b and c were taken. Lower panel: running average of mIPSC amplitude against time (50 event bins). Red circles indicate the mean mIPSC amplitude of each corresponding data set in the upper panel. The dotted line indicates the overall mean control amplitude before BDNF application. Ab, example traces of mIPSC activity obtained from periods indicated in Aa. Scale bars, 100 pA and 500 ms. Ac, overlaid average mIPSCs obtained from all events in control (n = 843) and test (n = 813) periods illustrated in Aa. Scale bars, 20 pA and 20 ms. Ba, pooled (n = 10) cumulative frequency distributions for mIPSC amplitudes obtained before (black line) and during (blue line) BDNF application, as illustrated in Aa. Bb, pooled (n = 10) cumulative frequency distributions for mIPSC interevent intervals obtained before and during BDNF application. Ca, pooled (n = 14) cumulative frequency distributions for mIPSC amplitudes obtained before (black line) and during (blue line) NT-3 (50 ng ml−1) application. Cb, pooled (n = 14) cumulative frequency distributions for mIPSC inter-event intervals obtained before (black line) and during (blue line) NT-3 application.
