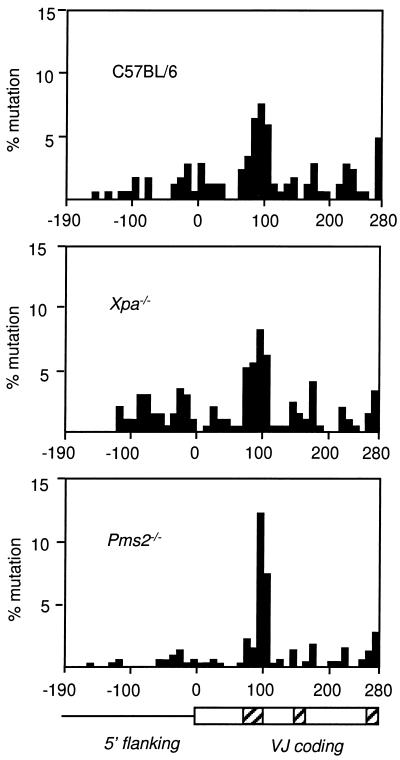
Figure 3.
Mutation frequency of 10-nt increments. A diagram of the gene with flanking (line) and coding (box) regions is shown at the bottom. The hatched rectangles within the coding region denote the three complementarity-determining areas of the antibody gene up to the J gene segment. The abscissa is numbered according to Fig. 1, and the frequency of mutation per 10-nt increments is calculated as the number of mutations per increment, divided by 10, divided by the number of clones, multiplied by 100.

