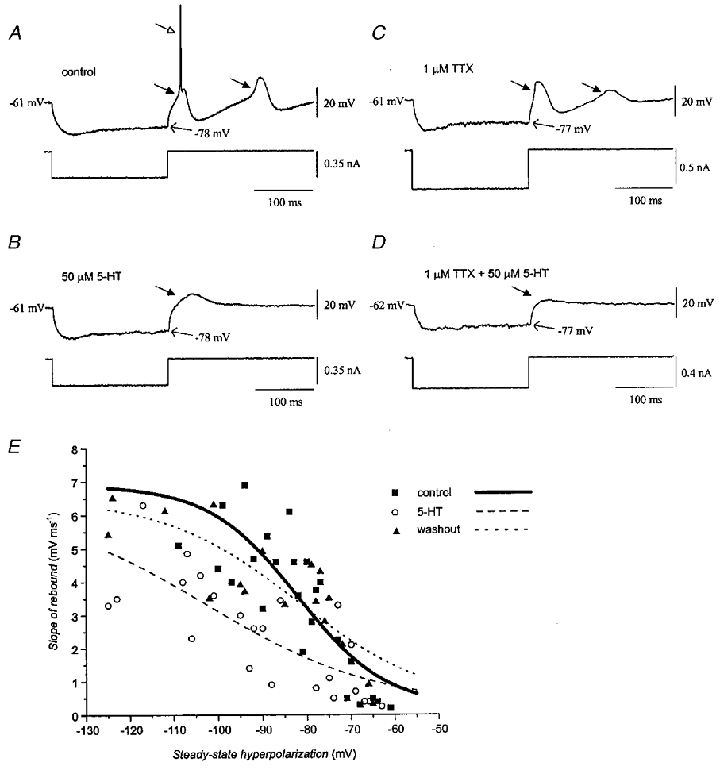
Figure 7. Effect of serotonin on the low-threshold calcium spike.

A, control record illustrating that release from hyperpolarization elicited a low-threshold calcium spike (filled arrow), in turn triggering a sodium spike (open arrow). In this trial, the rebound low-threshold spike that followed the afterhyperpolarization did not trigger a sodium spike. B, 50 μM serotonin prevented the elicited low-threshold spike from triggering a sodium spike or a following rebound. Same neurone as in A. C, in another neurone, TTX unmasked the low-threshold calcium spike and the ensuing calcium rebound. D, adding 50 μM serotonin to the TTX-treated neurone in C suppressed the low-threshold calcium spike. E, plots of the slope of the low-threshold spike triggered by release from hyperpolarization before (▪, continuous line), during (^, dashed line), and after (▴, dotted line) application of serotonin. Data from seven neurones were plotted as a function of the steady-state level of hyperpolarization produced by different current injections and were pooled from neurones that received 50 μM (n = 4) and 5 μM (n = 3) serotonin. Curves were calculated with the Boltzmann equation y = (A1–A2)/(1 + exp((V–V½)/g)) +A2, where A1 and A2 are the minimum and maximum values of the slope of the rebound, V½ is the membrane potential at which the slope of the rebound potential reached half-maximum, g is the slope factor, and y and V represent the slope of the rebound and the membrane potential, respectively. V½ was -82, -102 and -82 mV; g was -10, -19 and -15 mV; A1 was 0.2, 0.3 and 0.3 mV ms−1; and A2 was 6.9, 6.3 and 6.5 mV ms−1 for the control, serotonin and washout conditions, respectively.
