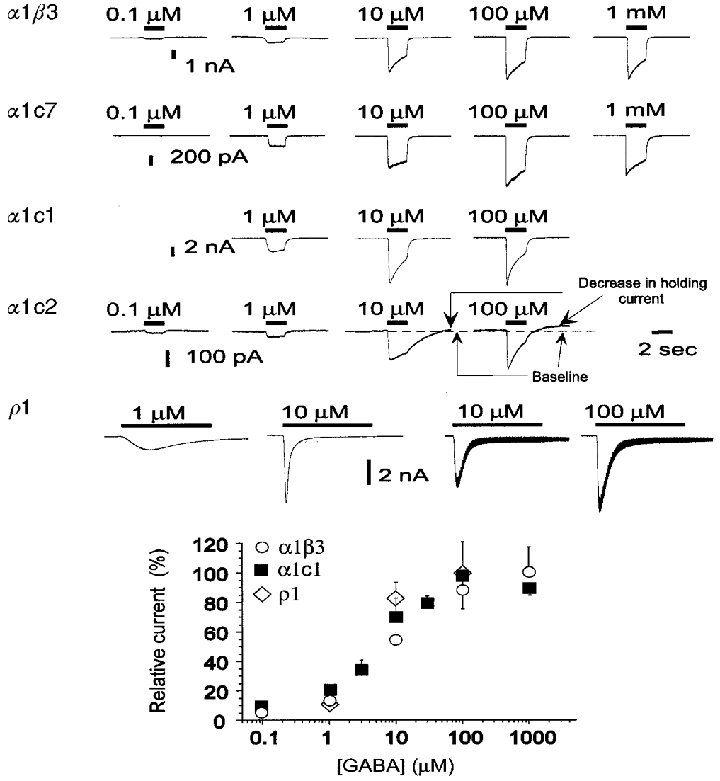
Figure 4. Activation by GABA is similar in receptors containing α1β3, α1c7, α1c1 and α1c2 subunits.

The upper panel shows traces of GABA-gated responses. In α1β3, α1c7, α1c1 and α1c2 responses were evoked by the application of GABA for 2 s. Preliminary observations indicated that in ρ1 homomultimers maximal responses are obtained only after 5–7 s at low GABA concentrations. Therefore in ρ1 homomultimers GABA was applied for 10 s. Responses shown for α1β3, α1c7, α1c1 and α1c2 were evoked in the same cell for each construct. In contrast, responses shown for ρ1 were evoked in two distinct cells: 1 and 10 μM traces on the left from one cell, and 10 and 100 μM traces on the right from another cell. In all constructs the maximal response is evident at concentrations of 100 μM GABA. The baseline conductance of cells transfected with α1c2 is higher than that of cells transfected with other constructs, and the holding current exhibits spontaneous fluctuations which probably correspond to spontaneous activity of unliganded channels. Also, the application of desensitizing concentrations of GABA causes a reduction of the holding current after removing GABA (see responses to 10 and 100 μM GABA), indicating an interaction between desensitizing GABA concentrations and the spontaneous activity. In ρ1 homomultimers application of 10–100 μM GABA evokes a large current that fades quickly. Most of this decline is the result of a redistribution of Cl− ions as a result of the large evoked currents. Redistribution is indicated by the observation that the conductance (measured by the change in current produced by 10 mV steps superimposed on the holding potential) reaches a peak at the peak of the current response, but remains high during the subsequent rapid fade of the current (see right-hand traces in bottom row, upper panel). The lower panel shows the concentration-response plots for the current evoked by GABA. In each experiment the measured values have been normalized to the response evoked at a determined concentration (10 μM in all constructs except α1c1 where 1 μM GABA was used). Finally, results have been renormalized to the maximal response. Plotted data are the means ±s.e.m. of values from 5 cells in α1β3 and α1c1 and 6 cells in ρ1. Data were fitted by the Hill equation, resulting in parameters shown in Table 1.
