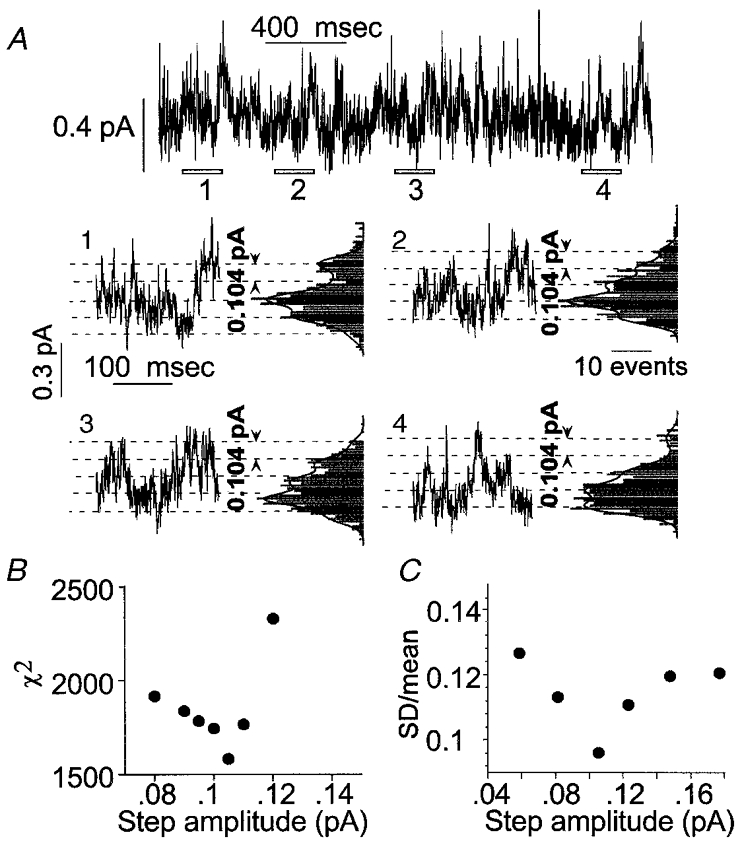
Figure 9. Analysis of cell-attached recordings of patches showing a high activity of low amplitude channels.

The record shown in the top line of A was obtained from a cell-attached patch on a cell transfected with α1 and c1 subunits. It was difficult to identify current steps corresponding to the opening or closing transitions of individual channels in these records, as they reflect the aggregate activity of a large number of channels of low unitary conductance. In order to define the amplitude of channel currents, each recording was divided into short consecutive stretches. The open bars marked 1 to 4 indicate a selection of such stretches at different times of the recording. The data segments are shown in A1 to A4, with corresponding all point current histograms. The histograms show regularly spaced peaks or shoulders. The lines show the sums of multiple Gaussian distributions with peaks separated by a constant value of 0.104 pA for all histograms. The unitary current will correspond to the peak spacing for the fitted Gaussian functions. Two tests were made of the idea that the all-points histograms could be described by the sum of multiple, equally spaced Gaussian components. The first was to fit all four distributions simultaneously with the sum of multiple Gaussian components. The total number of components was set to 6, and the step amplitude was varied in the fitting but kept constant for all histograms. For each histogram, there were additional parameters including the weight for each of the 6 components fitted, the s.d. for the components in each histogram (the same for all Gaussians fitted to a given histogram) and the baseline offset for each histogram. The fit was performed by minimization of χ2, using a Simplex algorithm. The best fitting value for the step amplitude was 0.104 pA, as illustrated. B shows values for χ2 for step amplitudes near this value, showing the minimum. The second approach was to analyse the original data segments using different assumed values for the step amplitude. For each assumed value, the data were divided into windows centred on integral multiples of the assumed step amplitude. The means and s.d.s were calculated in each window. If the appropriate step size were selected, each window would be centred on a single current level and the variance would be generated by open channel noise and transient values captured during opening or closing transitions. If, on the other hand, the step size were so large as to include more than one integral multiple of the single-channel current, the variance would be increased. Alternatively, at small step sizes the variance relative to the mean would also be increased because a larger proportion of the values would probably reflect transient values during transitions. The data shown in C indicate that coefficient of variation (s.d./mean) is minimized by step amplitudes of ≈0·1 pA (cell-attached recordings obtained with low Cl− extracellular saline at a pipette potential of 60 mV).
