
Figure 6. Quantal size is not altered by intense synaptic stimulation.
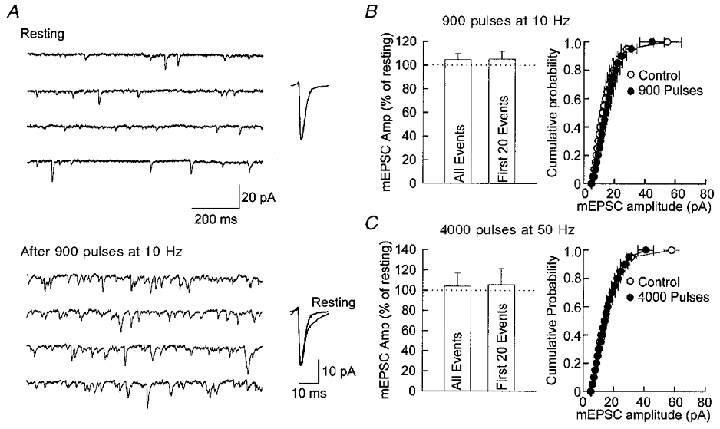
A, four consecutive traces of mEPSCs recorded from an autaptic neuron under resting conditions and after 900 pulses at 10 Hz. An increase in mEPSC frequency is seen after the stimulation, but the size of the average mEPSC remains the same. Average mEPSCs are shown to the right of the sample traces. B, mean amplitude (Amp) and distribution of mEPSCs are not altered after 900 pulses delivered at 10 Hz. Mean mEPSC amplitudes are 105 ± 5 % for all events and 105 ± 7 % for the first 20 events. The mean amplitude of all events (at least 100 events collected within the first minute after the stimulation) or the first 20 events after stimulation were not different from that under resting condition. The distribution of mEPSCs is not altered by stimulation, as shown by the cumulative probability plot on the right (n = 6). C, mean amplitude and distribution of mEPSCs are not altered after 4000 pulses delivered at 50 Hz (n = 5). Mean mEPSC amplitudes are 104 ± 13 % for all events and 105 ± 16 % for the first 20 events. All the above experiments were performed on confluent cultures, and field stimulation was delivered through two parallel platinum foil electrodes.