
Figure 3. Ca2+ dependence of isotonic shortening and power output in a skinned cardiac myocyte preparation.
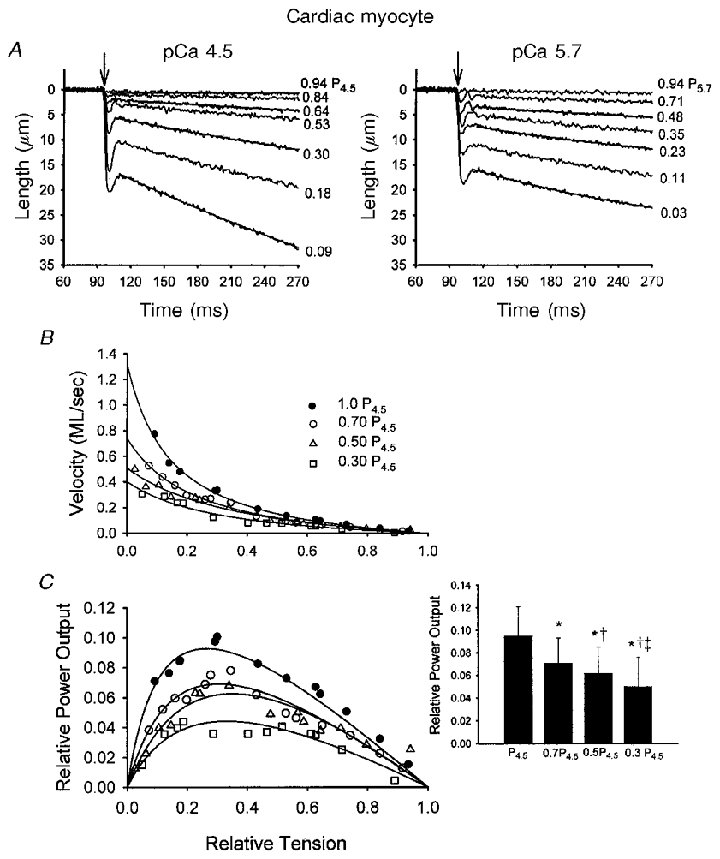
A, myocyte preparation length traces during different isotonic contractions at two different levels of Ca2+ activation (left, pCa 4.5; right, pCa 5.7). The percentage isometric force is written to the right of each length trace. The arrows indicate the onset of the force clamp. Fitted exponential curves are superimposed on every other length trace. The data were fitted using the equation L =Ae−kt+C as described in Methods. B, force-velocity relationships obtained during four different levels of Ca2+ activation in this myocyte preparation. As the level of activator Ca2+ was reduced, isometric force decreased; the relative forces (i.e. P/P4.5) are indicated. Reducing activator Ca2+ also resulted in a progressive downward shift in the force-velocity relationships (i.e. for a given relative load, shortening velocity was slower at lower Ca2+ activation levels). C, relative power-load relationships at the four different levels of Ca2+ activation in this myocyte preparation. There was a progressive reduction in power-load relationships as level of Ca2+ activation was reduced. The inset illustrates the changes in relative power output at different levels of Ca2+ activation for 8 cardiac myocyte preparations. *P < 0.05vs. P4.5; †P < 0.05vs. 0.7P4.5;‡P < 0.05vs. 0.5P4.5.