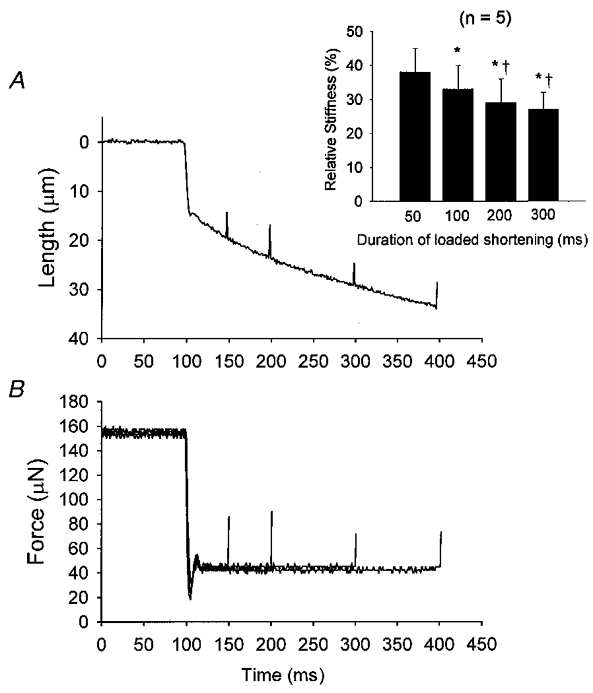
Figure 6. Effects of loaded shortening on the stiffness of a slow-twitch fibre during submaximal Ca2+ activation.

A, a length trace during a 300 ms load clamp (≈20 % of isometric force). Small length changes (≈0.4 % of fibre length) are superimposed at various times during the load clamp. B, force traces in response to the length changes. In this example, stiffness (ΔF/ΔL) was ≈16.00 N m−1 under isometric conditions and progressively decreased to 8.29, 7.11, 6.32 and 5.62 N m−1 after 50, 100, 200 and 300 ms of loaded shortening, respectively. The inset shows averaged changes in relative stiffness during loaded shortening for 5 slow-twitch fibre preparations. *P < 0.05vs. 50 ms, †P < 0.05vs. 100 ms.
