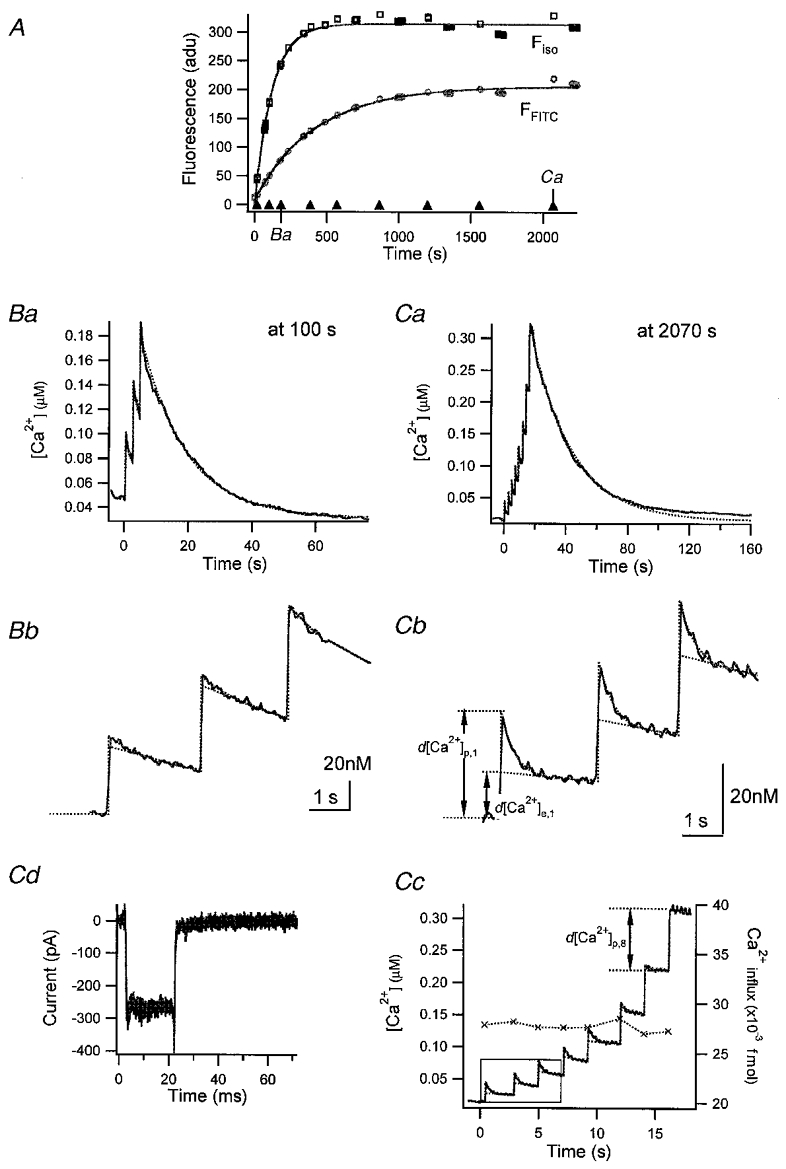
Figure 2. Parvalbumin loaded into adrenal chromaffin cells.

A, loading curve of fura-2 and FITC-PV. The quantities Fiso and F488 (see Methods) were plotted against time (s) elapsed after break-in. The loading curves were fitted with monoexponential curves (continuous lines) with τfura = 106.4 s for Fiso and τFITC = 372.3 s for F488. ▴, times when bursts of depolarizing pulses were given. In addition, the times when the Ca2+ traces displayed in Ba and Ca were recorded are marked. Ba, [Ca2+] transients evoked at 100 s after break-in. Bb, the [Ca2+] trace between 0 s (the time when the 1st pulse of this burst was given) and 7 s is depicted on an expanded time scale. Ca, [Ca2+] transients evoked by a train of 8 pulses given at 2070 s after break-in. Cb and c, [Ca2+] transients in the interval of 0 and 7 s (b) and those between −1 and 18 s (c) are re-displayed on an expanded time scale. Examples used for the estimation of various kinds of [Ca2+] increments (as defined in the text) are illustrated in Cb and c. The amount of calcium influx during pulses as calculated from Ca2+ current traces (Cd) is included in Cc (×, right axis).
