
Figure 3. Analysis of data presented in Fig. 2.
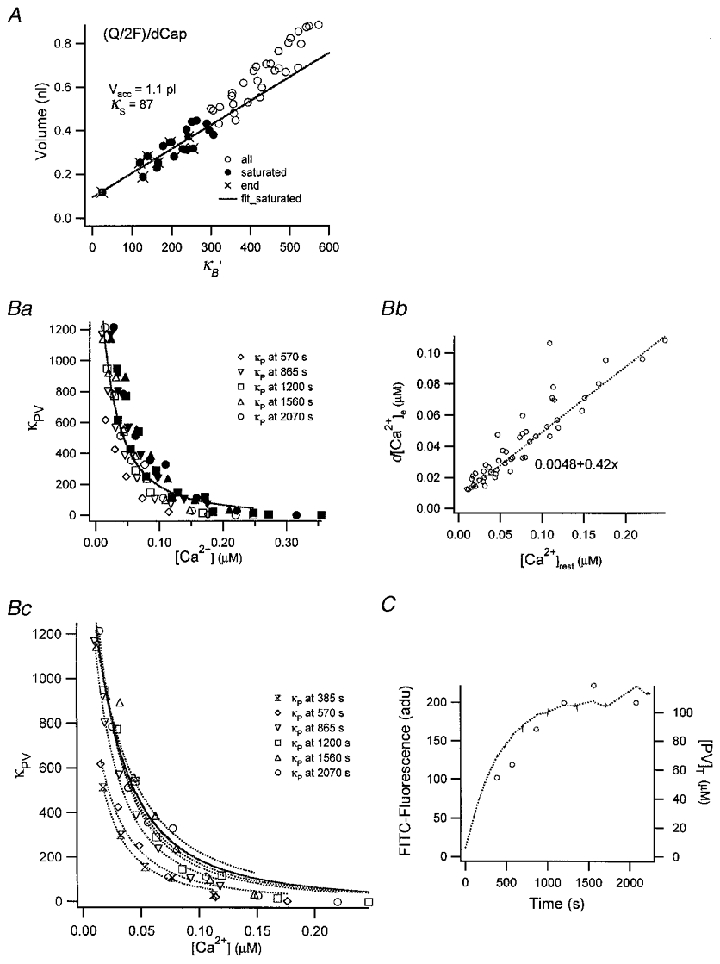
A, plot of the ratios between total amounts of Ca2+ influx (Qυ/2F) and peak amplitudes of [Ca2+] transients (d[Ca2+]p,υ) as a function of κB‘. Only the ratios measured from those [Ca2+] transients which lacked a fast drop phase (•) were used for the fit (continuous line). Accessible cell volume and κS were calculated from the slope ( = 1.1 pl) and the x-axis intercept ( = 87) of the regression line, respectively. Ba, plot of κP′ estimated from eqn (18) against [Ca2+]rest (the [Ca2+] before a given pulse, open symbols) and [Ca2+]peak (filled symbols). Values from fourth to eighth bursts are superimposed. Bb, plot of d[Ca2+]e as a function of [Ca2+]rest. d[Ca2+]e was fitted by 0.42[Ca2+]rest+ 0.0048 (μM). Bc, plot of κP′ estimated from eqn (18) as a function of [Ca2+]rest. Values for κP′ from different bursts are represented by different symbols. Dotted curves represent fits to values from a given burst. Parameters for the fits, [PV]T, are displayed in panel C. The continuous curve in Bc is the fit for κP′ obtained by pooling values from the last 3 bursts. C, plot of FFITC (dotted line, left axis) and [PV]T (○, right axis) estimated in panel Bc against loading time.