
Figure 3. ECG and action potential measurements.
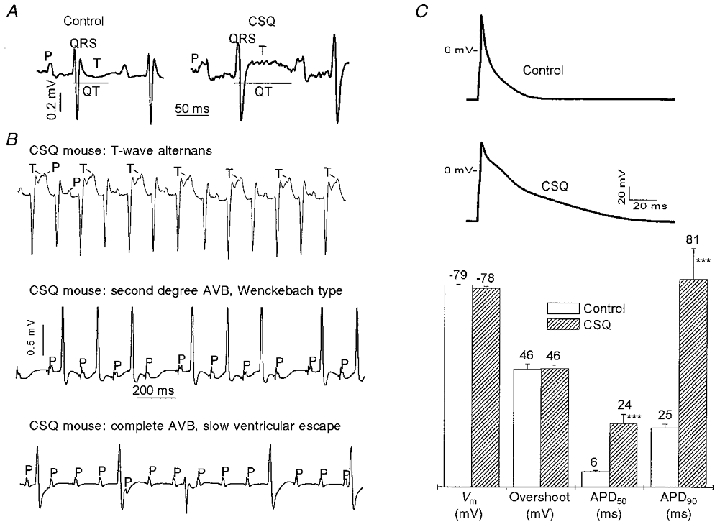
A, representative ECG tracings (lead II) from control and transgenic mice overexpressing CSQ (aged 139 and 134 days, respectively). The various parameters of the ECG are indicated; P represents atrial depolarization (P-wave) and T the ventricular repolarization (T-wave). A wider QRS complex and a prolonged Q-T interval were consistently encountered in CSQ mice. B, approximately 30 % of CSQ mice had an alternating pattern of the T-wave (lead II, T-wave alternans, top panel) in all age groups examined. A long P-R interval (P-R > 45 ms), higher degrees of atrioventricular block (AVB, lead I, middle and bottom panels) or QRS morphologies suggestive of conduction blocks (middle panel) were only present in CSQ mice older than 60 days. C, the cardiac action potential was significantly prolonged in ventricular cells from CSQ mice, both at the 50 % and the 90 % repolarization level (APD50 and APD90, respectively). Resting membrane potential (Vm) and overshoot potential were not significantly different. Mean values are given above each bar; error bars are s.e.m. Control: 19 myocytes from 3 hearts; mean age, 109 days. CSQ: 13 myocytes from 4 hearts; mean age, 139 days. *** P < 0.001 vs. control.