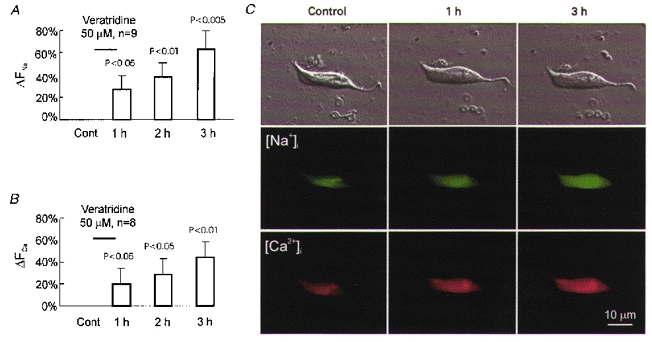
Figure 3. Cellular response to veratridine-induced Na+ influx.

A, results of Na+ imaging obtained from a group of neurones before (Cont), and after a 1 h exposure to 50 μM veratridine. B, results of Ca2+ imaging before (Cont), and after a 1 h exposure to 50 μM veratridine. C, simultaneous increase in [Na+]i and [Ca2+]i in representative neurones after veratridine exposure. Cells were preincubated with Sodium Green and Calcium Orange. Top row, phase-contrast images. Middle row, Na+ fluorescence images of the same neurone. Bottom row, Ca2+ fluorescence images of the same neurone. Note the increase in green and red fluorescence indicating a simultaneous rise in [Na+]i and [Ca2+]i.
