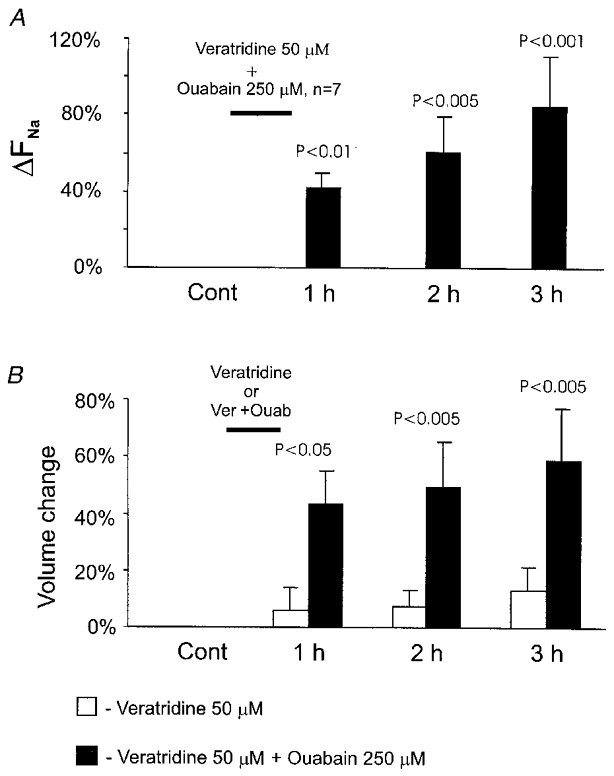
Figure 4. Cellular Na+ and volume responses to combined application of veratridine and ouabain.

A, results of Na+ imaging obtained from a group of neurones before (Cont) and after a 1 h exposure to 50 μM veratridine together with 250 μM ouabain. B, results of volume measurements obtained from the same groups of neurones as in A (veratridine plus ouabain) and Fig. 3A (veratradine alone).
