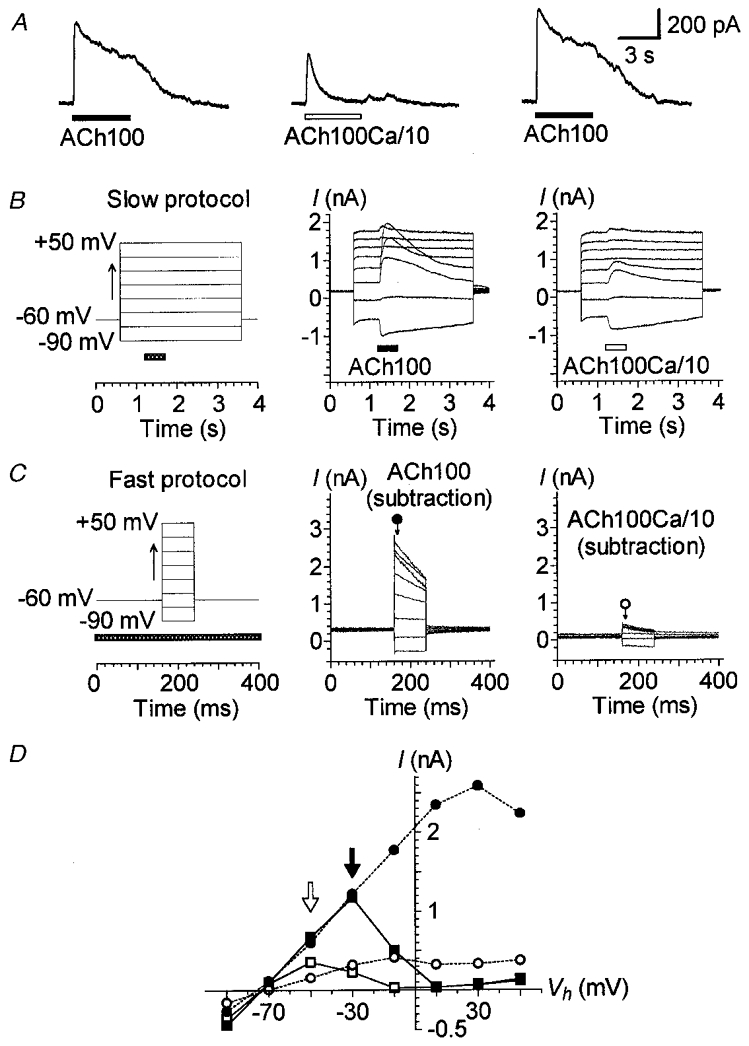
Figure 1. IK(ACh) depends on a Ca2+ influx.

A, effect of lowering extracellular Ca2+ concentration on IK(ACh). ACh (100 μM) was sequentially applied with 1 min intervals between applications. Stimulation was via two puff pipettes containing either a normal carrier solution (1.26 mM CaCl2: ACh100) or a carrier solution with a tenfold lower concentration of Ca2+ (0.126 mM CaCl2: ACh100Ca/10). Vh was set at -40 mV. B, effect of ACh100 and ACh100Ca/10 at different membrane potentials. The cell was stimulated by a slow protocol (left) consisting of 3 s voltage steps to between -90 and +50 mV in 20 mV increments triggered from a Vh of -60 mV. Voltage steps were spaced 30 s apart. ACh100 (middle) or ACh100Ca/10 (right) was applied (horizontal bar) for 500 ms at each voltage step, 600 ms after its onset. C, effect of varying the Vh during an ACh100 or ACh100Ca/10 application. This fast protocol (left) consisted of 80 ms voltage steps to between -90 and +50 mV in 20 mV increments from a Vh of -60 mV spaced 400 ms apart. The fast protocol was performed without ACh application (control), during a continuous 5 s application of ACh100, again in the absence of ACh application (control) and finally during a continuous 5 s application of ACh100Ca/10. The whole sequence was performed twice with a 1 min interval between applications. The pressure-puff application (horizontal bar) of ACh100 or ACh100Ca/10 started 1 s before the voltage-step protocol. The traces are net currents obtained after subtraction of control (leak) currents from those obtained during an ACh100 (middle) or ACh100Ca/10 (right) application. Current amplitudes reported in D were measured 8 ms after the onset of each voltage step as indicated by the arrows under the corresponding symbols. D, I-V relationships of the responses presented in B and C. Currents triggered by ACh100 (filled symbols) and ACh100Ca/10 (open symbols) were measured at their maximum amplitude for the slow protocol (squares) and as described in C for the fast protocol (circles). Filled and open arrows point to the maximum amplitude of the I–V relationships for ACh100- and ACh100Ca/10-evoked currents during the slow protocol, respectively. Recordings in A, B and C are from the same cell dialysed with internal solution 1. All these effects were reversible and repeated several times.
