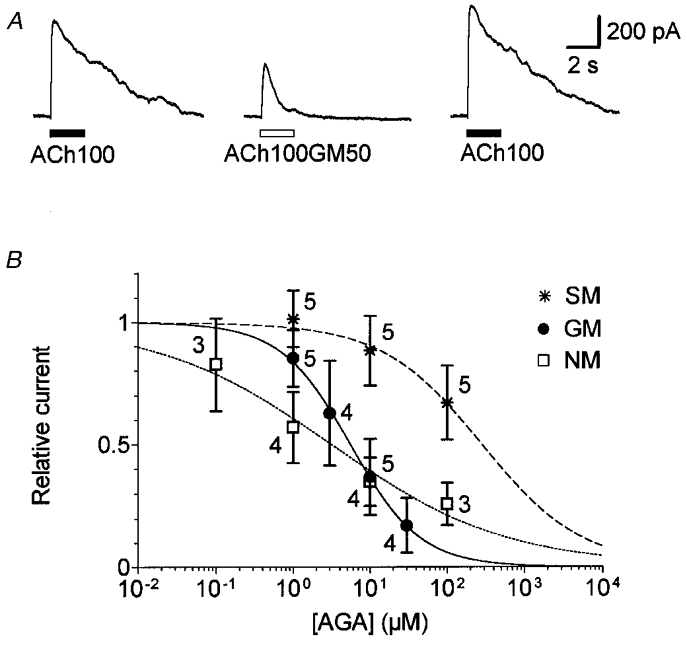
Figure 2. Aminoglycoside antibiotics reversibly block IK(ACh) in a dose-dependent manner.

A, effect of 50 μM gentamicin on IK(ACh). Cholinergic responses were evoked by sequential pressure-puff applications of 100 μM ACh alone (ACh100) or in combination with 50 μM gentamicin (ACh100GM50) with 1 min intervals between applications. Vh was set at -40 mV. B, relative amplitude of IK(ACh) as a function of aminoglycoside antibiotic (AGA) concentration. ACh was applied at 100 μM for 10 s alone and with increasing concentrations of gentamicin (•), neomycin (□) or streptomycin (*) by means of the U-tubing system. The amplitude of IK(ACh) was measured at the steady state (i.e. at the end of each 10 s application). To maximize current sizes, measurements were taken at 0 mV, 20 ms after a voltage step from -60 mV, as previously described (Eróstegui et al. 1994). Current amplitudes were expressed relative to the initial control value for each cell. Data represent the mean value (±s.d.) with the number of cells tested indicated beside each symbol. Dose-inhibition curves are the best fits calculated from the empirical Hill equation Y= 1/(1 + (X/IC50)nH) where X is the AGA concentration. For GM, IC50= 5.5 μM and nH= 0.95. For NM, IC50= 3.2 μM and nH= 0.38. For SM, IC50 and nH values were extrapolated to 282.6 μM and 0.66, respectively.
