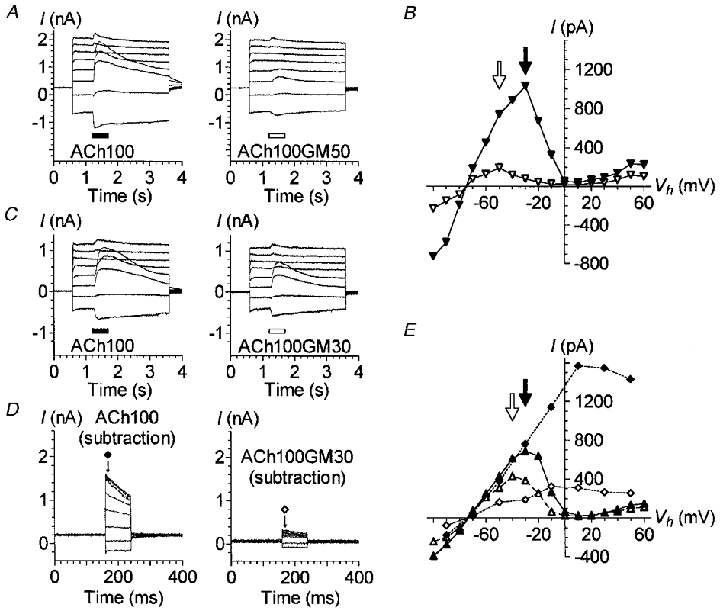
Figure 3. Block of IK(ACh) by gentamicin at different membrane potentials.

A, effect of 100 μM ACh alone or in combination with 50 μM GM at different membrane potentials. The cell was stimulated with a slow protocol as described in Fig. 1B. ACh100 (left) or ACh100GM50 (right) was applied for 500 ms at each voltage step, 600 ms after its onset. B, I-V relationships of the responses displayed in A, plus others obtained subsequently with a similar slow protocol but with voltage steps to between -100 and +60 mV. Currents triggered by ACh100 (▾) and ACh100GM50 (▿) were measured at their maximum amplitude (filled and open arrows, respectively). C, same experiment as in A, except that 30 μM GM, rather than 50 μM, was co-applied with ACh (ACh100GM30). D, effect of varying the Vh during an ACh100 or ACh100GM30 application using the same fast protocol as described in Fig. 1C. The traces shown are the net currents obtained after subtraction of the control (leak) currents recorded with the fast protocol in between ACh100 and ACh100GM30 applications. Current amplitudes reported in E were measured 8 ms after the onset of each voltage step as indicated by the arrows under the corresponding symbols. E, I-V relationships of the responses presented in D and C plus others as described in B. Currents triggered by ACh100 (filled symbols) and ACh100GM30 (open symbols) were measured at their maximum amplitude for the slow protocol (triangles) and as described in D for the fast protocol (diamonds). Filled and open arrows indicate the maximum amplitude of the I–V relationships for ACh100- and ACh100GM30-evoked currents during the slow protocol, respectively. A and B are from the same cell, C–E are from another cell. Both cells were dialysed with internal solution 1. All these effects were reversible and repeated several times.
