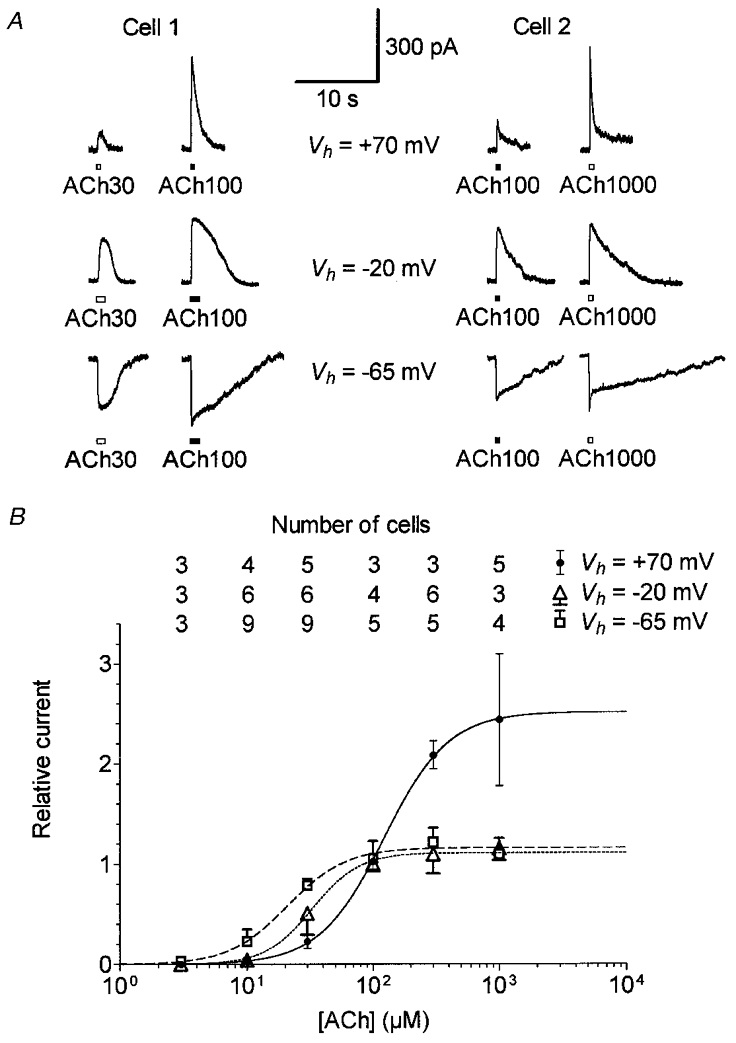
Figure 6. The dose-response relationship of the OHC cholinergic response shifts with membrane potential.

A, example of cholinergic currents from two OHCs evoked by pressure-puff application of 30 μM ACh (Cell 1) or 1000 μM ACh (Cell 2) compared with 100 μM ACh (used as reference) at Vh=−65, -20 and +70 mV. Internal solution 2, containing 100 mM CsCl and 1.1 mM EGTA, was used because it allowed extended recordings at positive potentials. B, dose-response relationships of the ACh-evoked currents at three Vh values. Peak amplitudes of ACh-evoked currents were expressed relative to the corresponding reference response obtained with 100 μM ACh. Each symbol is the mean relative response from the number of cells reported vertically for each Vh. For clarity, only +s.d., –s.d. and ±s.d. are displayed (unless masked by symbols) for measurements performed at -65, -20 and +70 mV, respectively. Some cells could be successively challenged at the three Vh values as exemplified in A. For each Vh, dose-response curves were fitted with the empirical Hill equation Y= 1/(1 + (EC50/X)nH). Best fits yield EC50 values of 21, 33 and 122 μM and nH values of 1.9, 2.3 and 1.7 at Vh=−65 mV (dashed line), -20 mV (dotted line) and +70 mV (continuous line), respectively.
