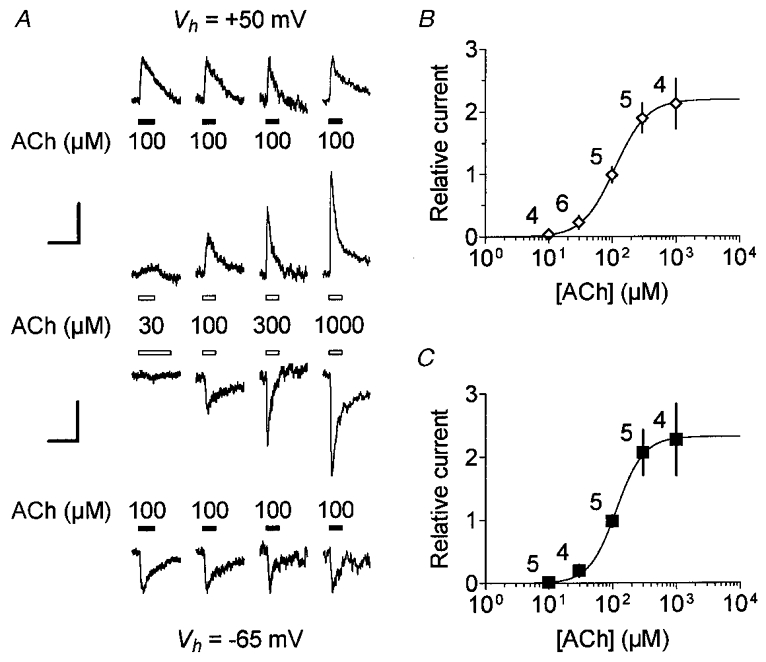
Figure 7. Dose-response relationships of the In(ACh) at two Vh values: voltage-independent low affinity of ACh for nAChRs.

A, example of cholinergic currents from four OHCs evoked by pressure-puff application of ACh at various concentrations compared with 100 μM ACh (used as reference) at Vh=−65 and +50 mV. The 10 mM BAPTA buffered internal solution 3 was used to prevent IK(ACh) activation. The vertically aligned traces were from a single cell first challenged at -65 mV. The current traces of the four OHCs tested for increasing concentrations of ACh (as indicated in the middle) are displayed horizontally. To improve visual comparison, reference responses were scaled to the same peak amplitude both at +50 mV (top) and at -65 mV (bottom). Vertical scale bars therefore represent, from left to right traces, 167, 184, 115 and 280 pA at +50 mV and 88, 51, 70 and 143 pA at -65 mV, while horizontal scale bars represent 1 s for all traces. B, dose-response relationship of the ACh-evoked cation current at +50 mV. Peak amplitudes of ACh-evoked currents were expressed relative to the corresponding reference response at 100 μM ACh. Each symbol is the mean relative response (±s.d.) from the number of cells indicated beside. The dose-response curve was fitted with the empirical Hill equation Y= 1/(1 + (EC50/X)nH). Best fit yields an EC50 of 110 μM and a nH of 1.8. C, the dose-response relationship of the ACh-evoked cation current at -65 mV. Plots and fits were performed as described in B but with current recorded at -65 mV. Some cells could also be challenged at +50 mV as shown in A. Data represent the mean relative response (±s.d.) with the number of cells indicated beside each symbol. Best fit yields an EC50 of 114 μM and a nH of 2.0. For clarity in B and C,±s.d. are displayed as simple bars unless they are masked by symbols.
